

Vizex
This
 Display
Display Properties Pane
The Display Properties option has been added on the Window tab, in the Panes group to hide/show the Display Properties pane.
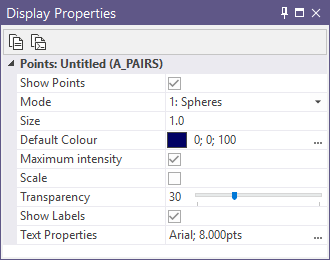
When you select a display object in Vizex, you can view and (sometimes) edit the display properties of that object. The Type of the current layer and the Name of the current layer are also displayed at the top of the Display Properties pane.
Display properties for an object are separate from the data properties which are shown in the Properties pane.
For more information on the new pane, see Display Properties.
Advanced Line Styles
A number of advanced Line styles have been added to Vizex to enhance the flexibility of Display options across the application.
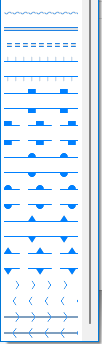
Extended line styles are displayed in blue in the Line Type drop down in any form where available.
Note: Extended line styles such as double lines are not compatible with 2D plots (they will render as a solid line) and will only display properly in Vizex and 3D Vizex plots (and screenshots).
Search Ellipsoid Display Properties
Display Properties have been enabled for Search Ellipsoid to enable the quick and simple changes to the display of an ellipsoid:
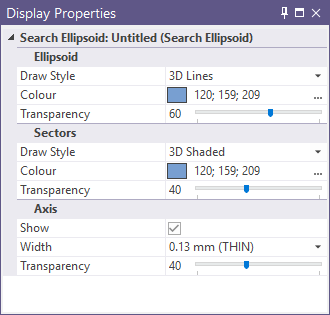
The properties make best use of the new Display Properties pane; enabling changes to be made to the Ellipsoid, Sectors and Axis display.
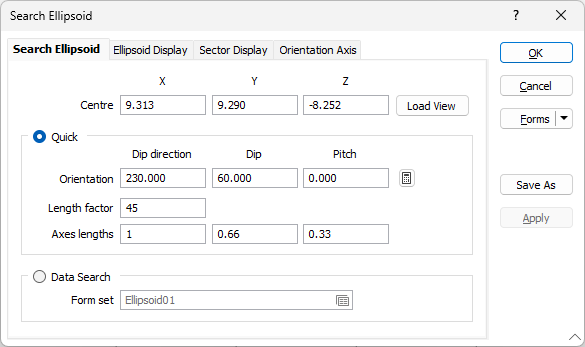
Additionally, the Quick options have been added to the Search Ellipsoid form to enter the Dip Direction, Dip and Pitch values manually or from rotation calculation, as well setting a Length factor and Axes Length values for the ellipsoid. Setting the Quick display options precludes the need to select a Data Search form set.
For more information, see Search Ellipsoid.
Default Legend Entry
An entry for instances of the Default value has been added to the Legend to support interactive visibility of defaults. For example, the Benches legend for the Trace layer.
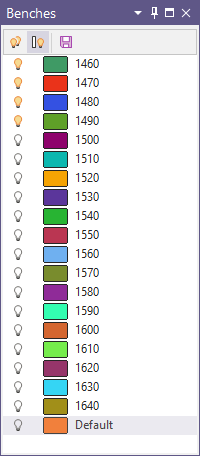
The Default entry will appear in the legend any time a Default value is present. In the common scenario that the Default isn't used at all, the entry will not be displayed. Other legend items are still displayed even if their usage count is 0.
For more information, see Display a legend.
Structural Ribbon Display Properties
Structural Ribbon controls have been added to the Display Properties pane in Vizex. When a ribbon is selected, values will be shown for the control fields in the panel:
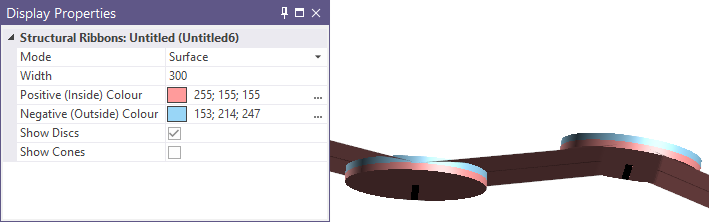
The controls in the panel can be used to modify the display mode, ribbon width, positive/negative colours, and toggle display of discs and cones - without using the tools in the Vizex | Structural Ribbons ribbon.
For example, you can toggle the display mode for the structural ribbon layer using the Mode drop down:
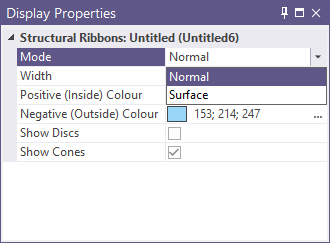
For more information, see Interacting with Structural Data.
Layers
Simple Points Display
The Input Data options for the Points layer have been simplified to allow the quick configuration of Points display using the Quick Display Options.
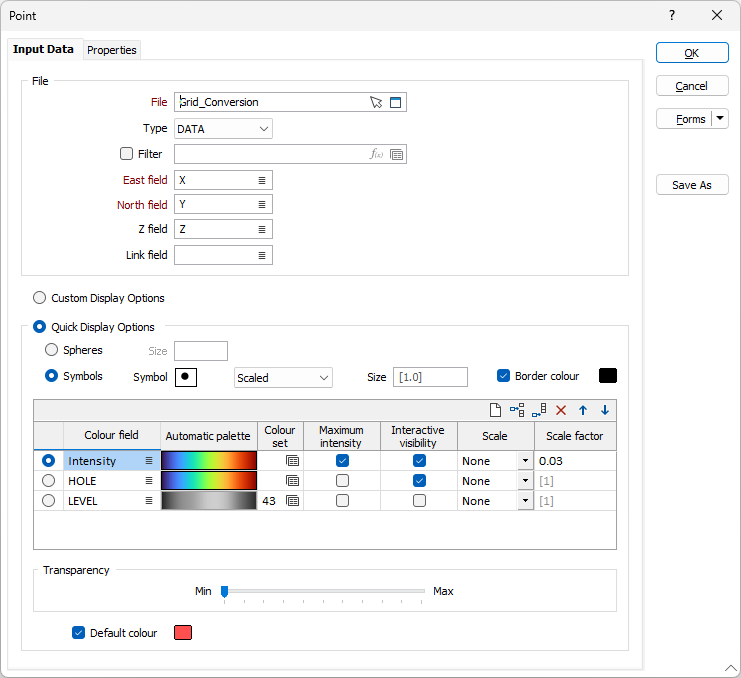
If Quick Display Options is selected, the other tabs are disabled and the Quick Display options are activated to enable configuration of the Points display.
The Spheres and Symbols options determine the display of points, while the fields in the grid are used to set the colour and other details for the selected Colour field for the points layer.
For more information, see Point.
Simple Block Model Display
The Input Data options for the Block Model layer have been simplified to allow the quick configuration of Block Model display using the Quick Display Options.
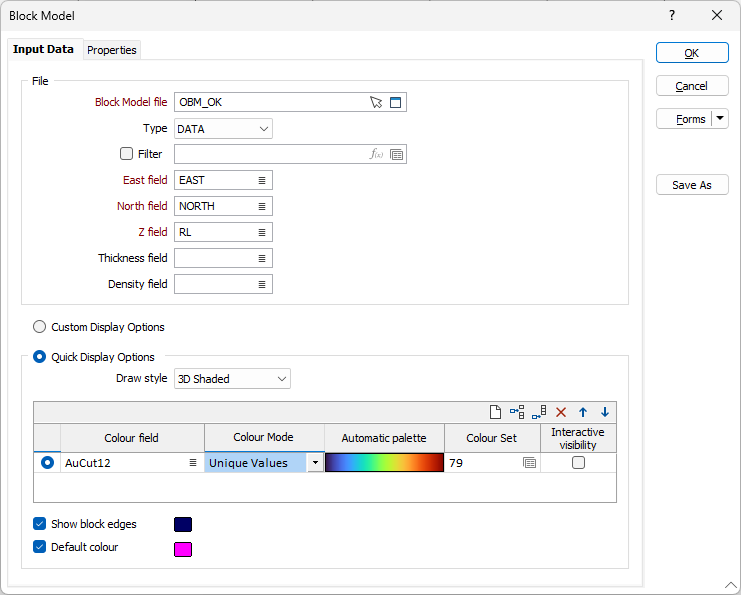
If Quick Display is selected, other tabs besides Input Data and Properties are disabled and the Quick Display options are activated to enable configuration of the Block Model display.
The Draw style drop down determines the displayed draw style, while the fields in the grid are used to set the colour and other details for the selected Colour field for the Block Model layer.
For more information, see Block Model.
Simple Interval Display
Support for Quick Display mode has been added to the Graph Interval and Hatch Interval layers in Vizex to allow the quick configuration of display using the options provided. For example, in the Graph form:
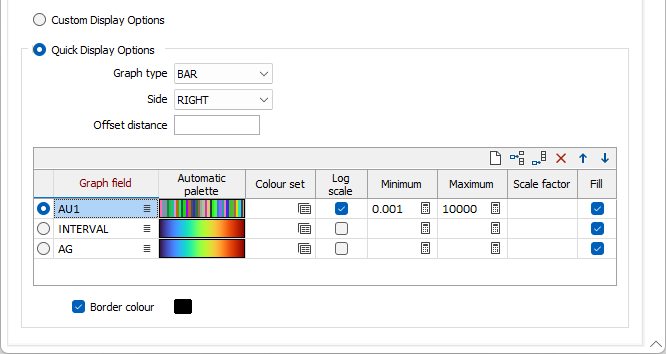
If Quick Display Options is selected, the other tabs are disabled and the Quick Display options are activated to enable configuration of the interval display.
For more information, see Interval Graph and Interval Hatch.
Enhanced Drillhole Solid Trace
Improvements have been made to the performance of the Drillhole Solid Trace layer in Vizex.
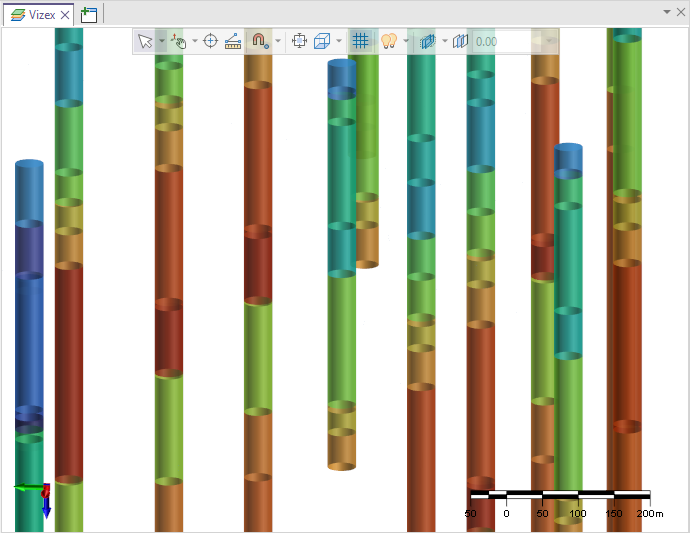
With an internal upgrade to an advanced shader, support has been added for better performance to load more than 35,000 holes without any slowing of application resources.
For more information, see Solid Trace
Plot
Plot Template Locations
The Location option has been added to all Plot tools featuring a Template field to support the selection of the rootfor the associated plot template file location.
For example, when generating a new plot file:
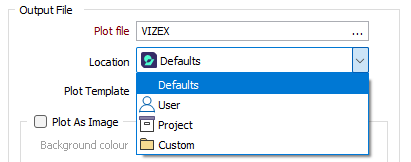
If the Location is set to Defaults, the location of the default plot templates will be automatically entered in the Plot Template field.
The available options for the Location of plot files are as follows:
-
Defaults: The default Environment folder in the application installation location.
-
User: The user-specific (local) Environment folder for the application installation.
-
Project: The current project directory.
-
Custom: A specified location outside of the three known locations.
The Default location for Plot templates is: %AllUsersProfile%\Micromine\Micromine\Environment
Note: The Defaults option is not available when saving a template.
For more information, see Generate Plot File.