

Point

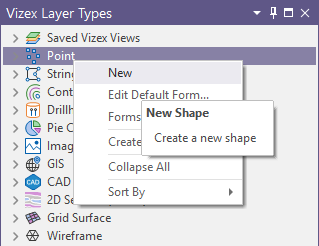
Alternatively, you can right click the layer node in the Vizex Layer Type tree and select New.
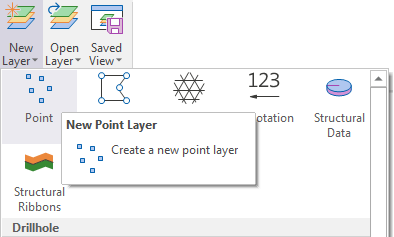
Or select New Layer | Point from the Layer group.
Points can be displayed as simple shapes, or as scaled symbols. You can also display them in Pie Charts format. Typical uses are for the display of geochemical plots and block model values.
Input Data
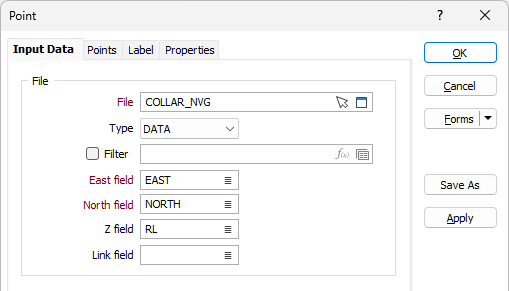
The Input Data tab of the Point form has the following parameters:
File
Double-click to select a Data file to load. Optionally, select or create a filter to limit the data that is processed.
To create a new file, right-click in the file input box and select New from the right-click menu.
You can also click the Pick from Vizex button to collapse the form and interactively select a layer containing the file to be inserted and return to the form.
When creating a new layer in Vizex, a template which defines the structure of a DAT file is applied automatically. See: File Templates
East and North (and Z) fields
Specify the names of the fields in which Easting, Northing, and (optionally) Z coordinates are stored in the source file. In the X, Y, Z coordinate system, these are the X , Y and Z directions.
Link field
Optionally specify the name of a text field in the file which is used to define the parameters of a hyperlink. See: Interactive Data Links
Display
Select whether to configure the Points layer using Custom Display Options or Quick Display Options.
If you select Custom Display Options, the Points, Label and Properties tabs are enabled for configuring the Points display.
If Quick Display Options is selected, the other tabs are disabled and the Quick Display options are activated to enable configuration of the Points display.

Spheres
Select the Spheres option to display the point or hole information as a 3D sphere of the selected colour. Symbol options will be disabled. Enter a Size for the sphere or leave the default.
Symbols
Select the Symbols option to enable the display of point or hole information as a selected symbol.
Symbol
Double click the Symbol field to select the symbol to use.
Scale/Size
Using the drop down menu, you can select to display the symbol in a Fixed or Scaled size and enter the Size in the field provided.
If you select Auto from the Scale drop down, the symbol will be displayed at the optimal scale/size for the points layer display.
Border Colour
Select the option to enable a border around the displayed symbol and select a colour by double clicking in the selection box.
Display Grid
The fields in the Display grid are used to configure the Colour field and colour for the displayed points, as well as set intensity and visibility options.
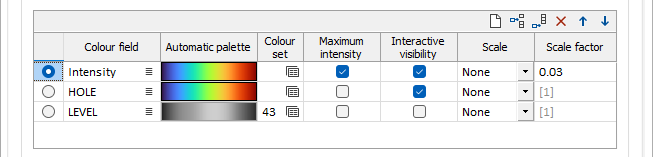
Use the buttons on the local toolbar to Manage the rows in the list.
Enable
Select the Enable option for the display settings you want to apply to the Points layer. Only one configured display can be applied at a time.
Colour field
Specify the name of a field which contains the values that will be used to colour-code the display.
Automatic palette
Double click in the Automatic palette field to select a palette and automatically apply colour ranges to the data.
Colour Set
To map values in the Colour field to the colour values in a Colour set, double click (F3) to select the set that will be used to control the display colour. Right-click (F4) to create or edit a Colour set.
Selecting a colour set will override any palette selected in the Automatic palette field.
Maximum intensity
Select this option to use Maximum Intensity Projection (MIP) to highlight points of interest.
Normally, when there are overlapping symbols in a point display, closer points will hide points that are further away. However, when the Use Maximum Intensity Projection (MIP) method is enabled, the highest values are always displayed on top of progressively lower values. Even if the Colour field is a character field the same principle applies. Point ‘Z’ will display above point ‘A’. This ordering is maintained irrespective of changes to the view orientation, making it easier to visualise trends in masses of point data.
Interactive visibility
Select the Interactive visibility option to enable the interactive visibility panel for the Points layer.
When this option is enabled a histogram shows the distribution of those values; you then adjust the visibility of points by moving sliders along the histogram.
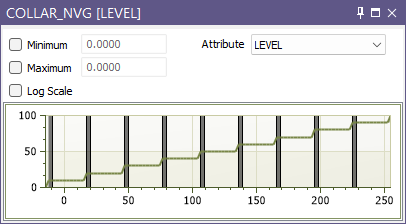
For information on using the panel for the points display, see Interactive Point Visibility
Scale
Select a Scale option for the points display - None, Normal or Log Scale.
You can use values directly from the nominated field
in the input file, or you can take natural logs of the data before it is
displayed. To use the base values as they occur, choose NORMAL from the
Scale Factor
Enter a scaling factor - typically a value <1.0. The value to which it is applied is multiplied by this factor before being displayed. Use this option to prevent graphs from overwriting other holes.
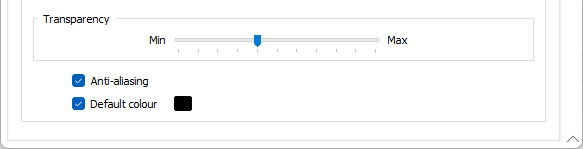
Transparency
Use the transparency slider to specify the intensity of the display layer. The visibility of the layers underneath the current display layer will be determined by the degree of transparency you select.
Anti-aliasing
Select this option to apply anti-aliasing to smooth the symbols; producing perfectly round edges. For some point layer, you may prefer to leave anti-aliasing off: Dense point clouds, for example, may appear "noisy" due to the anti-aliased edges of the points.
Default colour
Double-click (F3) to select the colour that will be used when a Colour field or a Colour set is not defined - or when a value in the Colour field is either not valid or is not mapped in the Colour set.
Forms
Click the Forms button to select and open a saved form set, or if a form set has been loaded, save the current form set.
By design, the Forms button is not available for loaded Vizex layers (i.e. when opening the form set properties of a layer in the Vizex Layer Display pane). In Vizex, the Forms button is only available for new forms opened via the Home tab or the Vizex tab, in the Layer group (or by double-clicking on a form type node in the Vizex Layer Types pane).
Save and Save As
Click the Save button to save the changes you have made to the form set. Click Save As to save your changes as a new form set. Save As will default to the first available form set number.
Manage
Click Manage to open the Form Set Manager for the current form.
Reset
Click Reset to clear the form of all values and reset the form to its default state.
Reset Tab
For tabbed forms, select Reset Tab to clear the active tab of all values and reset the tab to its default state - without making any changes to other tabs in the dialog.
Undo and Redo
Click Undo (CTRL + Z) to undo recent changes in the form. After an Undo, click Redo (CTRL + Y) to restore the last change that was undone.
Collapse
Collapse (roll-up) the form to preview a chart, or preview the results of an operation in Vizex, or obtain input values from Vizex, the Property Window, the File Editor, or the Plot Editor.