

Interactive Point Visibility
The Interactive Point Visibility option makes it easy to show or hide points based on numeric values in the file. When this option is enabled a histogram shows the distribution of those values; you then adjust the point visibility by moving sliders along the histogram.
If a colour set has been applied to that field in the displayed point layer, the same colours will appear on the histogram background.
To enable the Interactive Visibility tool:
- Open an existing, or create a new, Vizex Point form.
- Switch to the Points tab and enable Interactive Point Visibility.
- Choose an Attribute field and enable Minimum or Maximum (or both) as needed.
If you select the Minimum option, you can specify a minimum value for the Points layer display scale. Similarly, the Maximum option enables you to specify the maximum value for display:
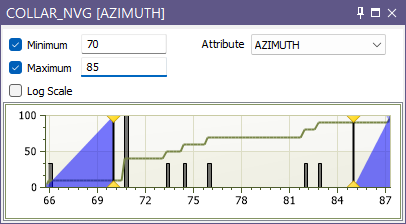
- Click OK to display the points. Vizex will also display the histogram in a floating window.
- The triangular handles on the top and bottom edge of the histogram, indicate the position of the Minimum and Maximum visibility lines. Click and drag the lines to adjust the Minimum and Maximum visibility values.
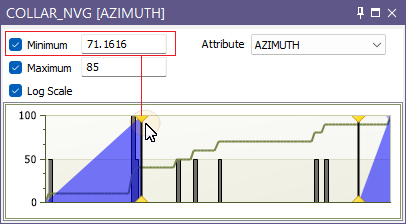
Alternatively, if you know where you want to go, you can just click in the Visibility window and the line will move to that point.
Optionally enable the Log Scale option to rescale the histogram for positively-skewed data such as gold assays.
Using a logarithmic scale improves the display of wide-ranging element concentration data (such as rare earth and other trace elements) over and above more common polar or radial display styles.
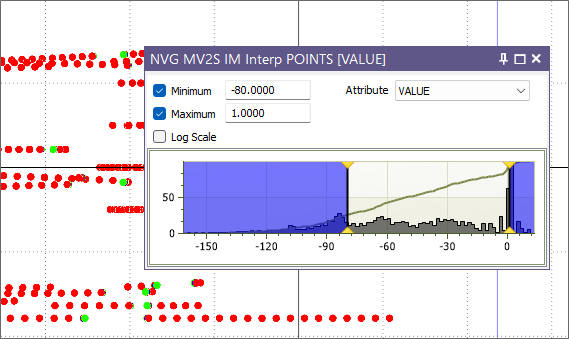
If you inadvertently close the Visibility window, you can refresh the layer to display it again. To temporarily hide the Visibility window use the pin icon on the Visibility window’s title bar. When you move focus away from the window, the window is hidden but the title bar is still visible. Simply move the mouse cursor over the title bar to display the window again