

Block Model
On the Home tab or the Vizex tab, in the Layer group, select Open Layer | Block Model (or double-click Block Model in the Vizex Layer Types pane) to open a Block Model in Vizex.

Typically, block models can be used as a background layer to define the area of interest, for example, during pit design. When you are in Plan view, and have the 2D Slice draw style selected, the blocks you see are restricted to those which intersect the current Z value.
Be aware that if you use a Block Size Factor, the current Z value may fall "between" the blocks in your model, and you may not see anything in the display. Either change the Block Size Factor or change the Z value in the display limits.
In Vizex, you can change the orientation of the model by selecting one of the View options on the Vizex tab, in the Viewpoint group . You can also hold down the SHIFT key and use the PAN tool to rotate the model in 3D.
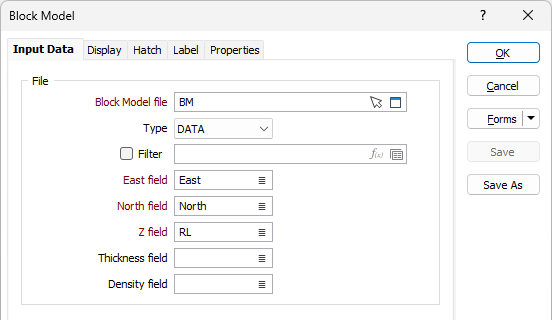
Block Model file
Double-click (or click on the Select icon) to select the name of the block model file you want to display. Select the type of the file from the drop-down list. You can also click the Pick from Vizex button to collapse the form and interactively select a layer containing the file to be inserted and return to the form.
Filter
Optionally, select or create a filter to limit the data that is processed.
If you select the Filter check box, you can select an existing filter or create one using the Expression Editor by clicking the icon.
East, North and Z fields
Enter the name of the fields in the file in which the Easting, Northing, and Z coordinates are stored.
Thickness field
A 3D block model contains fields that automatically define the block size, so the Thickness field is not required.
In a Seam Block Model file, the East and North dimension fields are known, but the elevation block size (thickness) field is user-defined, and therefore needs to be selected. Double-click (or click on the Select icon) to select the name of the field containing the vertical thickness of the blocks.
Density field
If the grades of the blocks are expressed as mass-weighted grades (e.g. g/t), then Density field values are required.
Double-click (or click on the Select icon) to select the name of the field containing the density of the blocks.
Display
Select whether to configure the Points layer using Custom Display Options or Quick Display Options.
If you select Custom Display Options, the Display, Hatch, Label and Properties tabs are enabled for configuring the Block Model display.
If Quick Display Options is selected, the other tabs are disabled and the Quick Display options are activated to enable configuration of the Block Model display.
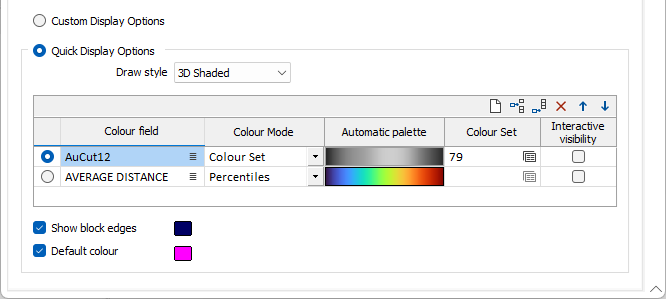
Draw Style
Use the drop down to select the required draw style for display of the block model - see Display for details of each available style.
Display Grid
The fields in the Display grid are used to configure the Colour field and colour for the displayed block model, as well as optionally select interactive visibility.
Enable
Select the Enable option for the display settings you want to apply to the block model. Only one configured display can be applied at a time.
Colour field
Specify the name of a field which contains the values that will be used to colour-code the display.
Colour Mode
Choose a mode of calculation:
| Mode | Description |
|---|---|
| Colour Set | Select this option to apply a specified Colour Set to the block model display. |
| Percentiles | The application will divide the data into ranges each containing the same number of values; the highest and lowest value in each bin will define the upper and lower values for each range. |
| Ranges | The data will be divided into equal ranges. |
| Unique values |
A colour will be assigned to each unique value. |
Automatic palette
Double click in the Automatic palette field to select a palette and automatically apply colour ranges to the data.
Note that the auto colour set controls are disabled when a Colour field is unspecified:
Colour Set
To map values in the Colour field to the colour values in a Colour set, double click (F3) to select the set that will be used to control the display colour. Right-click (F4) to create or edit a Colour set.
Selecting a colour set will override any palette selected in the Automatic palette field.
Interactive visibility
Select the Interactive visibility option to enable the interactive visibility panel for the layer.
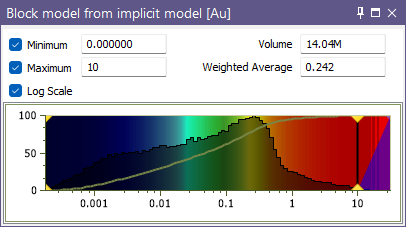
In the Display Properties pane, you can use the Interactive Visibility options to toggle the display of data:
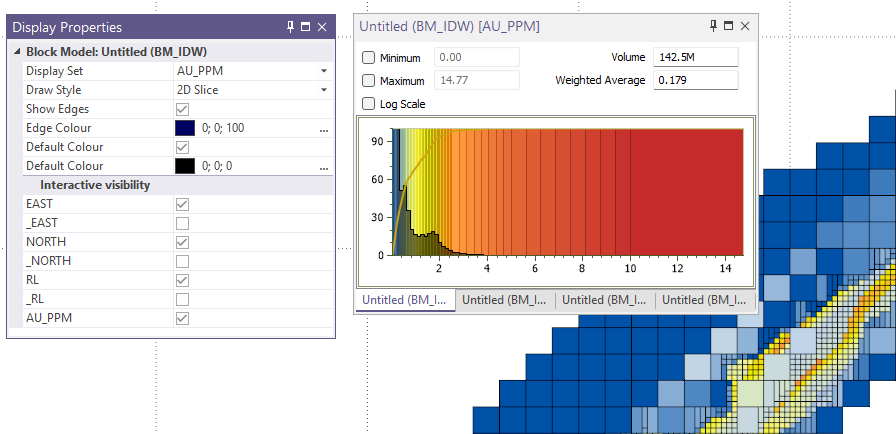
For each option enabled, a tab will be created for display of the data in the Interactive Visibility panel. See Interactive Block Visibility.
Show block edges
Select this option to show the lines between blocks in the block model display.
Default Colour
Double-click (F3) to select the colour that will be used when a Colour field or a Colour set is not defined - or when a value in the Colour field is either not valid or is not mapped in the Colour set.
Forms
Click the Forms button to select and open a saved form set, or if a form set has been loaded, save the current form set.
By design, the Forms button is not available for loaded Vizex layers (i.e. when opening the form set properties of a layer in the Vizex Layer Display pane). In Vizex, the Forms button is only available for new forms opened via the Home tab or the Vizex tab, in the Layer group (or by double-clicking on a form type node in the Vizex Layer Types pane).
Save and Save As
Click the Save button to save the changes you have made to the form set. Click Save As to save your changes as a new form set. Save As will default to the first available form set number.
Manage
Click Manage to open the Form Set Manager for the current form.
Reset
Click Reset to clear the form of all values and reset the form to its default state.
Reset Tab
For tabbed forms, select Reset Tab to clear the active tab of all values and reset the tab to its default state - without making any changes to other tabs in the dialog.
Undo and Redo
Click Undo (CTRL + Z) to undo recent changes in the form. After an Undo, click Redo (CTRL + Y) to restore the last change that was undone.
Collapse
Collapse (roll-up) the form to preview a chart, or preview the results of an operation in Vizex, or obtain input values from Vizex, the Property Window, the File Editor, or the Plot Editor.