

Interval Graph

Database
Double-click (F3) to select
Optionally, select or create a filter to limit the data that is processed.
If you select the Filter check box, you can select an existing filter or create one using the Expression Editor by clicking the icon.
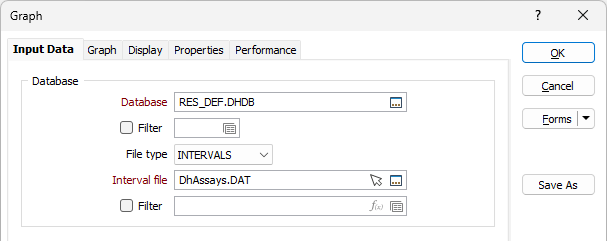
File type
You can display graphs of interval data or event data. Event occur at specific depths down the hole. Choose an INTERVALS or EVENTS graph type from the drop-down list.
Interval file
Double-click (or click on the Select icon) to select the name of the file that contains the data you want to display. You can also click the Pick from Vizex button to collapse the form and interactively select a layer containing the file to be inserted and return to the form.
Optionally, select or create a filter to limit the data that is processed.
If you select the Filter check box, you can select an existing filter or create one using the Expression Editor by clicking the icon.
A filter can be useful when you want to apply a restriction on a field other than the one being displayed, for example, to show the assays in a particular zone, or show the assays for specific holes.
Display
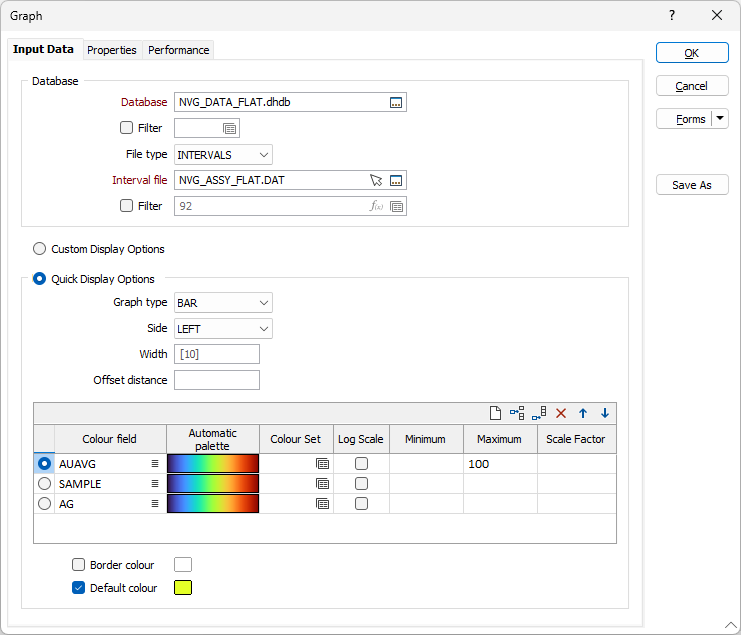
Select whether to configure the Interval Graph layer using Custom Display Options or Quick Display Options.
If you select Custom Display Options, all tabs are enabled for configuring the interval.
If Quick Display Options is selected, tabs other than Properties and Performance are disabled and the Quick Display options are activated to enable configuration of the interval graph display.
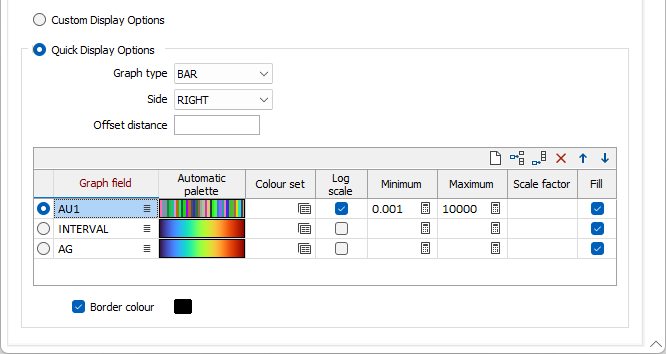
Graph Type
Select the type of graph that will be displayed alongside the drillhole trace or trench:
- BAR - Displays each value as a bar.
- LINE - Displays a smoothed line between values.
- POINTS - Each graph value is shown as a point symbol.
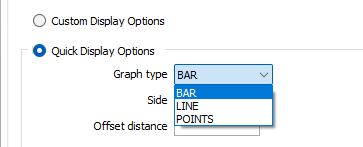
Side
The graph can be displayed on the LEFT or RIGHT of the drillhole trace. Use the Side drop down list to determine its location.
Offset distance
Define the distance, in grid units, that the graph will be offset from the trace. The default is 1. Both positive and negative values are acceptable.
Graph field(s)
In Quick Display mode, the grid at the bottom of the tab is enabled to allow selection of the fields in the interval file to be graphed.
You can double click in a Colour field cell (or click the List icon) to select the name of a field to be graphed.
Use the buttons on the local toolbar to Manage the rows in the list.
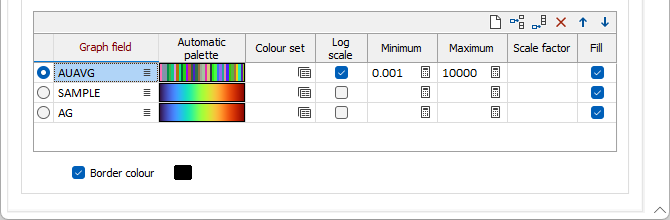
Enable
Select the Enable option for the configured Colour field you want to display in the graph. Multiple Colour fields can be configured, but only one can be displayed in the graph at one time.
Graph field
Specify the name of a field which contains the values that will be used to colour-code the display.
You can choose to select colour values directly from the Colour field without selecting a Colour set. In this case, the values in the Colour field must be valid RGB, Hex, or Integer colour definitions.
| Format | Example |
|---|---|
| R,G,B | 89,169,215 |
| HTML Hex | #59A9D7 |
| Hex | 0x59a9d7 |
| int | 5876183 |
Automatic
Select Automatic to select a palette and automatically apply colour ranges to the data. The Save As Colour Set button provides the option to save the result as a colour set.
Note that the auto colour set controls are disabled when a Colour field is unspecified:
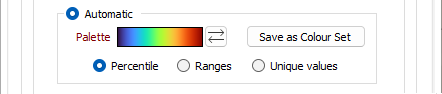
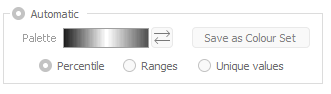
Choose a mode of calculation:
| Mode | Description |
|---|---|
| Percentile | The application will divide the data into ranges each containing the same number of values; the highest and lowest value in each bin will define the upper and lower values for each range. |
| Ranges | The data will be divided into equal ranges. |
| Unique values | A colour will be assigned to each unique value. |
Colour set
To map values in the Colour field to the colour values in a Colour set, double click (F3) to select the set that will be used to control the display colour. Right-click (F4) to create or edit a Colour set.
Log Scale
Select the Log Scale option to apply the size for the colour field interval graph display on a Log Scale
Minimum and Maximum
You may need to recalculate the minimum and maximum graph values to produce a correct histogram from older (earlier version) form sets, but generally only for those incorporating the natural log transformation.
You should not have to change the graph minimum or maximum of existing forms incorporating normally-distributed data.
These values are the simplified version of the Minimum and Maximum (Cut-off) values on the Display tab in Custom Display mode.
Clicking the Calculate button for each value will automatically calculate the Minimum and Maximum from the available data.
Scale factor
Enter a scaling factor - typically a value <1.0. The value to which it is applied is multiplied by this factor before being displayed. Use this option to prevent graphs from overwriting other holes.
Fill
Select the Fill option for any graph fields to be displayed with a filled foreground from the specified palette. If this option is not selected, the graph element will be outlined with a border but not filled.
Border Colour
Set the colour of the border. Double-click on the Colour icon to select a colour from a colour palette.
Forms
Click the Forms button to select and open a saved form set, or if a form set has been loaded, save the current form set.
By design, the Forms button is not available for loaded Vizex layers (i.e. when opening the form set properties of a layer in the Vizex Layer Display pane). In Vizex, the Forms button is only available for new forms opened via the Home tab or the Vizex tab, in the Layer group (or by double-clicking on a form type node in the Vizex Layer Types pane).
Save and Save As
Click the Save button to save the changes you have made to the form set. Click Save As to save your changes as a new form set. Save As will default to the first available form set number.
Manage
Click Manage to open the Form Set Manager for the current form.
Reset
Click Reset to clear the form of all values and reset the form to its default state.
Reset Tab
For tabbed forms, select Reset Tab to clear the active tab of all values and reset the tab to its default state - without making any changes to other tabs in the dialog.
Undo and Redo
Click Undo (CTRL + Z) to undo recent changes in the form. After an Undo, click Redo (CTRL + Y) to restore the last change that was undone.
Collapse
Collapse (roll-up) the form to preview a chart, or preview the results of an operation in Vizex, or obtain input values from Vizex, the Property Window, the File Editor, or the Plot Editor.