

Properties
If you want to display one or more calculated averages for the drillhole interval graph, select one of the options on the Properties tab.
Select whether to display calculated averages for All fields, No fields, or a Custom collection of fields.
If you selected Custom, you can configure the fields for which you want calculated averages displayed using the grid. You can use the tools for the grid to Manage the rows in the list and add each field required.
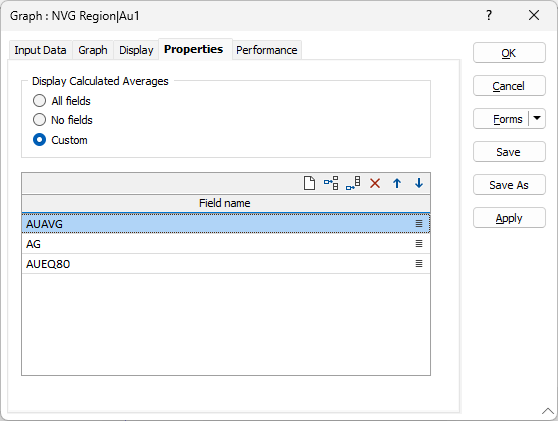
The fields selected in the Properties tab will be displayed in the Average grid of the Data Properties pane for the drillholes.
Use the options provided on the Performance tab to determine the level of detail to be shown in the display.