

Drillhole Trace

You can also specify the size and smoothness of the cylinders displayed along a Solid Trace.
Input Data
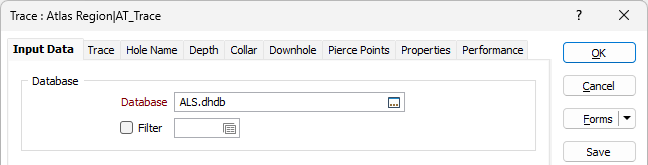
Database
Trace coordinates are generated automatically when you create a Drillhole Database. The database contains the collar and (optionally) the survey data needed to generate the trace.
Double-click (F3) to select
Optionally, select or create a filter to limit the data that is processed.
If you select the Filter check box, you can select an existing filter or create one using the Expression Editor by clicking the icon.
Display
Select whether to configure the Trace layer using Custom Display Options or Quick Display Options.
If you select Custom Display Options, all tabs are enabled for configuring the Trace.
If Quick Display Options is selected, tabs other than Properties and Performance are disabled and the Quick Display options are activated to enable configuration of the Trace display.
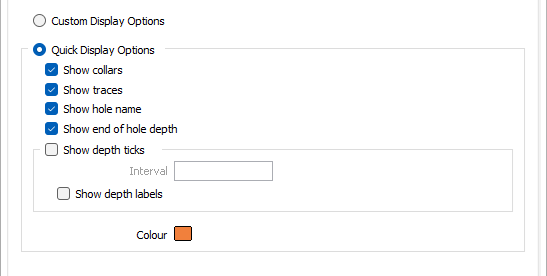
Show collars
Select the Show collars option to display the hole collar at the start of the drillhole trace.
Show traces
Select the Show traces option to enable the display of the trace for each drillhole.
Show hole name
Select the Show hole name option to specify that hole names should be displayed
Show end of hole depth
Select the Show end of hole depth option if you want to display the hole depth at intervals along the drillhole trace.
Show depth ticks
Select the Show depth ticks option to enable the display of ticks for the downhole data.
Interval
If you have opted to Show depth ticks, you can enter the Intervalat which to display ticks. Use grid units. The default value is 10.
Show depth labels
Select the Show depth labels option to display depth labels for the trace.
Colour
Select a Colour to be used to display the downhole data labels and ticks.
Forms
Click the Forms button to select and open a saved form set, or if a form set has been loaded, save the current form set.
By design, the Forms button is not available for loaded Vizex layers (i.e. when opening the form set properties of a layer in the Vizex Layer Display pane). In Vizex, the Forms button is only available for new forms opened via the Home tab or the Vizex tab, in the Layer group (or by double-clicking on a form type node in the Vizex Layer Types pane).
Save and Save As
Click the Save button to save the changes you have made to the form set. Click Save As to save your changes as a new form set. Save As will default to the first available form set number.
Manage
Click Manage to open the Form Set Manager for the current form.
Reset
Click Reset to clear the form of all values and reset the form to its default state.
Reset Tab
For tabbed forms, select Reset Tab to clear the active tab of all values and reset the tab to its default state - without making any changes to other tabs in the dialog.
Undo and Redo
Click Undo (CTRL + Z) to undo recent changes in the form. After an Undo, click Redo (CTRL + Y) to restore the last change that was undone.
Collapse
Collapse (roll-up) the form to preview a chart, or preview the results of an operation in Vizex, or obtain input values from Vizex, the Property Window, the File Editor, or the Plot Editor.