Trace
Use the options provided on the Trace tab to configure the custom display options for the trace.
Display Trace
Select this option if you want to display the trace, using either a line thickness or a cylinder, and with a default colour or a colour coding.
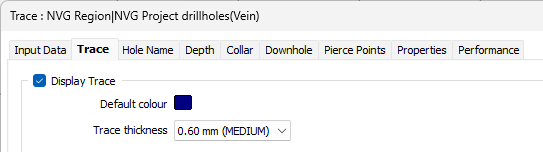
Default colour
Double click (F3) to choose the colour that will be used if Colour Coding (below) is not selected.
Trace thickness
Select a (THIN, MEDIUM, THICK, or custom) line width from the drop-down list. An extensive selection of custom widths (in millimetres) are available for selection.
Colour Coding
Optionally, you can colour code the trace, either using field values in an Interval File, or using field values in the Collar File.
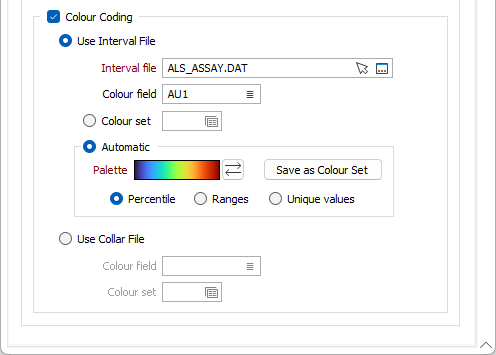
Interval file
If you have chosen to colour code the trace using field values in an Interval file, enter (or double-click to select) the name of the file. You can also click the Pick from Vizex button to collapse the form and interactively select a layer containing the file to be inserted and return to the form.
Right-clicking to select Open Input File on a trace with downhole data will show the corresponding downhole file and highlight the current record. Right-clicking to select the same option on a trace with no downhole data will show the Collar file and highlight the current record.
Colour field
Specify the name of a field which contains the values that will be used to colour-code the display.
You can choose to select colour values directly from the Colour field without selecting a Colour set. In this case, the values in the Colour field must be valid RGB, Hex, or Integer colour definitions.
| Format | Example |
|---|---|
| R,G,B | 89,169,215 |
| HTML Hex | #59A9D7 |
| Hex | 0x59a9d7 |
| int | 5876183 |
Colour set
To map values in the Colour field to the colour values in a Colour set, double click (F3) to select the set that will be used to control the display colour. Right-click (F4) to create or edit a Colour set.
Automatic
Select Automatic to select a palette and automatically apply colour ranges to the data. The Save As Colour Set button provides the option to save the result as a colour set.
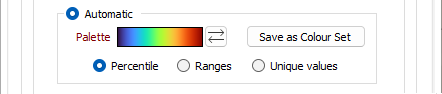
Choose a mode of calculation:
| Mode | Description |
|---|---|
| Percentile | The application will divide the data into ranges each containing the same number of values; the highest and lowest value in each bin will define the upper and lower values for each range. |
| Ranges | The data will be divided into equal ranges. |
| Unique values | A colour will be assigned to each unique value. |
Use the Reverse palette button to reverse the display of the palette. A mode of calculation can be selected and the option to Save the result as a Colour Set is provided. Note that the auto colour set controls are disabled when a Colour field is unspecified.
Note: When creating or editing a Drillhole Database, if you choose to ignore errors during auto-validation, holes where the hole depth is missing or is negative, are added to the database and flagged as invalid.
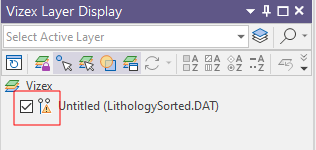
When displaying a Drillhole Trace in Vizex, holes which are invalid are displayed with a red cross at the collar and a warning icon is also added to the layer to show that the displayed data contains errors.