

Geostatistics
This
 Aggregation
Aggregate Block Model
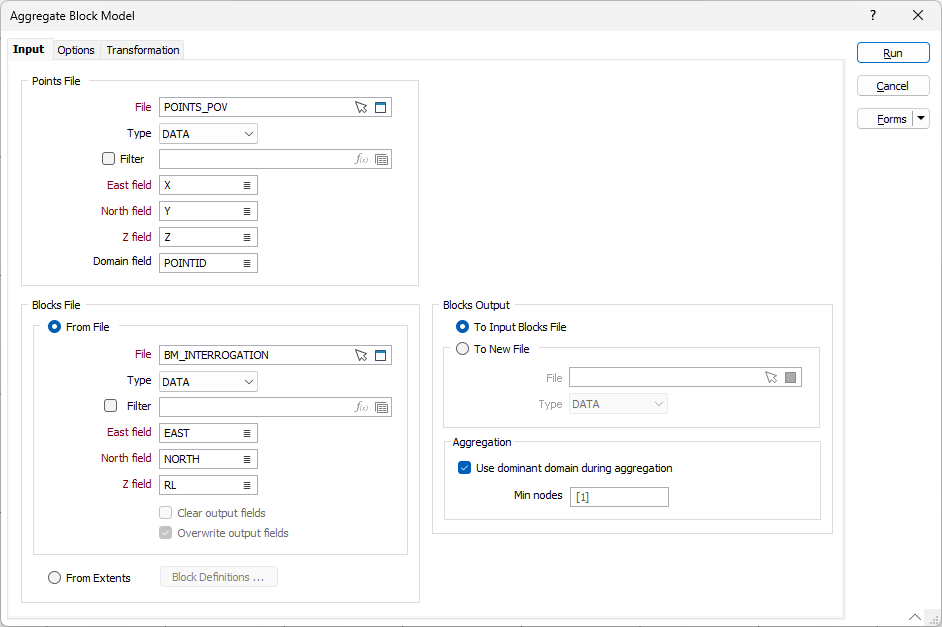
The Aggregate Block Model tool has been added to the Geostatistics tab, in the Simulation group to allow aggregation of block model data to a coarser resolution.

The Aggregate Block Model tool simulates values at a tight grid spacing from a specified Points file and averages up to the relevant block size to observe volume-variance relations to a selected output file or back to the input. For example, the tool can take simulated nodes and reblock to SMU size or from SMU size to resource block model.
For more information, see Aggregate Block Model.
Transformation
Normal Scores Transform
The Normal Scores Transform tool has been added to the Geostatistics tab, in the Transformation group to support performing normal scores transform on data, as well as creating a transform file that can be used with Conditional Simulation.

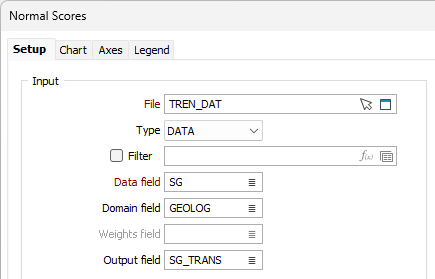
The Normal Scores tool converts a numeric variable to standard normal scores using an empirical Cumulative Distribution Function (CDF). You can optionally enter declustering weights and partition by domain.
Normalisation of data in mining is often required for data sets with a variety of units and at different scales spread over a large range. Normalising the data will simplify it and keep it consistent while retaining the most important details.
Normal Scores produces a reusable transform file which supports forward transform and configurable back-transform, including editable tail modelling. The transform file can be used with the Conditional Simulation tool so that variograms on the grade data are based on normal scores data. See Conditional Simulation Workflow.
Transform files can be used with Conditional Simulation, with Setup (Chart and Map), and to transform data values forwards or backwards using the new Apply Transform tool.
For more information, see Normal Scores Transform.
Apply Transform
The Transform tool has been added to the Geostatistics tab, in the Transformation group to support transformation of data values forwards or backwards using a pre-made transform file.

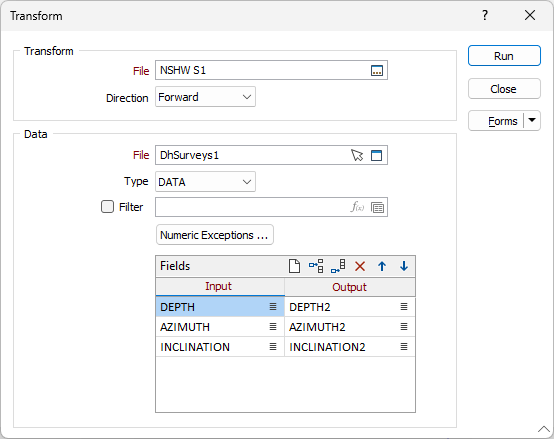
The new tool allows you to select a Transform file to be used and specify either a forward or backward direction for the transformation. Transform files can be created using the new Normal Scores Transform tool.
With a data file selected for transformation, you can specify the fields to be transformed and where the results should be written.
For more information, see Apply Transform.
Variography
Variogram Control File Viewer
The Variogram Control File viewer, accessible from the Geostatistics tab, in the Variography group has been updated to provide editable information for the Create Control File tool.
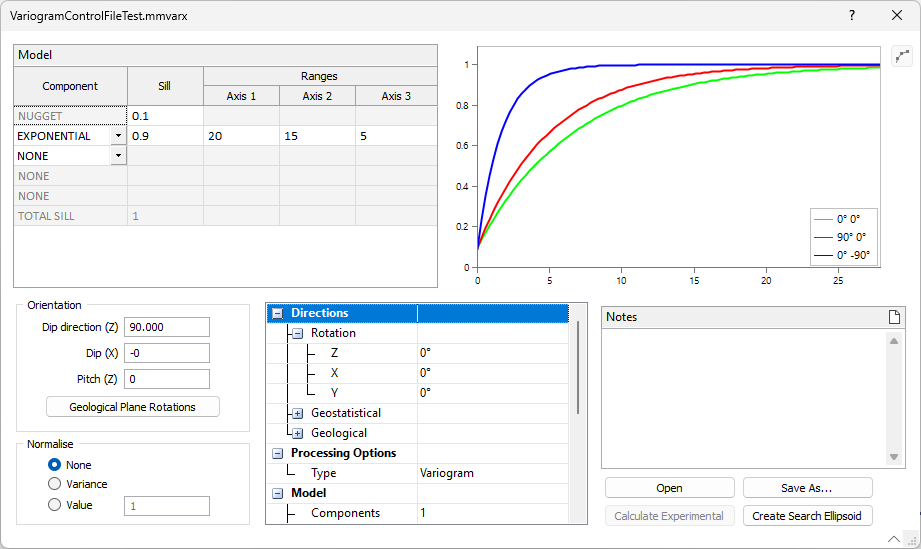
The Model grid allows editing of the variograms for the file. The default model is added to the details upon creation, and you can modify this if required, as well as change each Component cell in a blank row of the grid from None to a variogram model component to be configured.
The Dip Direction, Dip and Pitch orientation values can be entered in the Orientation fields, and the Geological Plane Rotations can be used to view or edit the parameters for the orientation of a geological plane that can be applied to your variograms.
For more information, see Create Control File.
Create Control File
The Create Control File tool has been added to the Control File menu on the Geostatistics tab, in the Variography group to create and edit a new Variogram Control file.

The new tool opens a new variogram control file in the standard viewer, which can be edited and modified using the Model grid, Orientation values and other fields and options.
For more information, see Create Control File.
Transform File Support
Support for the new Transform file has been added to the Variogram Map and Semi Variogram tools on the Geostatistics tab, in the Variography group.
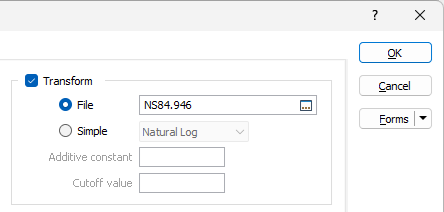
For both of these tools, you can specify a Transform file to transform the data in the analysis before calculation. Selecting a transform file will disable the other Transformation options. Transform files can be created using the new Apply Transform tool.
For more information, see Variogram Map and Semi Variograms.
Charts
Stereonet Grid Custom Projection
Support for displaying a grid in a custom projection based on a selected calculation method or a specified Plunge and Azimuth has been added to the Stereonet tool on the Analysis tab, in the Stereonet group.
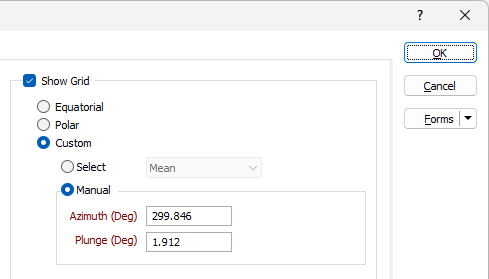
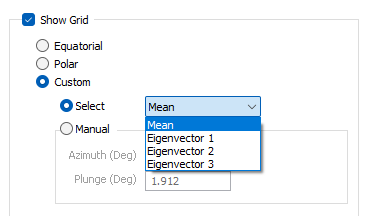
If Custom is selected, you can choose Select and specify a grid calculation method from the drop down list:
If you select the Manual option, you can manually specify the Plunge and Azimuth (in degrees) for the grid projection.
Previously, the grid could be based on an Equatorial or Polar stereographic projection.
Additionally, the Select Pole tool has been added to the Stereonet tab in the Stereonet group to enable selection of a custom pole position when viewing the Stereonet.
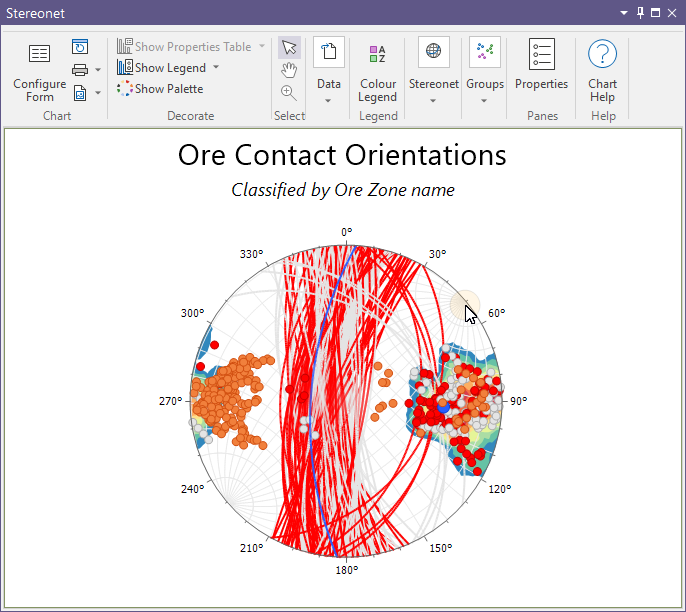
For more information, see Stereonet.
Histogram Log Normal Toggle
The Log Normal button has been added to the Chart | Histogram ribbon in the Histogram group to toggle between Log Normal and Linear scale display.

- LINEAR scale displays the actual values for the Graph field subject to the settings in Numeric Exceptions.
- NATURAL LOG scale displays values from the Graph field converted into their natural logarithm.
Using the new button, you can quickly display either scale without modifying the form. The Log Normal button is available for Histogram and Histogram (Multivariate).
For more information, see Apply Transform.