

Normal Scores Transform

The Normal Scores tool converts a numeric variable to standard normal scores using an empirical Cumulative Distribution Function (CDF). You can optionally enter declustering weights and partition by domain.
Normalisation of data in mining is often required for data sets with a variety of units and at different scales spread over a large range. Normalising the data will simplify it and keep it consistent while retaining the most important details.
Normal Scores produces a reusable transform file which supports forward transform and configurable back-transform, including editable tail modelling. The transform file can be used with the Conditional Simulation tool so that variograms on the grade data are based on normal scores data. See Conditional Simulation Workflow.
Input
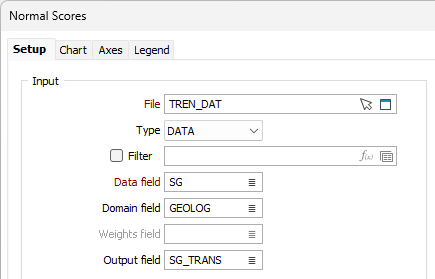
The Input options on the Setup tab are used to specify the input data to be normalised, including optional domain and weighting fields, as well as the field in the file for the output data.
File
Select a file type and double-click (or click on the Select icon) to select the name of the input file.
Optionally, select or create a filter to limit the data that is processed.
If you select the Filter check box, you can select an existing filter or create one using the Expression Editor by clicking the icon.
Data field
Enter (F3) or double click in the Data field to select the field in the input file which contains the data for the Normal Scores process.
Domain field
Optionally select the field in the file containing Domain (categorical/code) information. If this field is not provided, all rows of data will be considered as a single domain. If a domain field is selected, the populated rows will be listed in the Domains grid.
Weights field
Optionally select the field in the input file which contains declustering Weights information. If domains are selected, this field can be defined for each domain.
Note: Domains are not used when only a single column of weights is required.
Domains
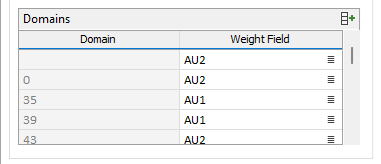
The Domains grid displays any domains present in the input file, acquired from the specified Domain field.
The Weight Field value is populated where available with the values from the specified Weights field. You can optionally select a Weight Field for each Domain in the grid.
Domains
The values in the Domains grid can be automatically calculated from the Input file to provide a Domain and a Weight Field value for each domain.
Domain
The Domain column displays the categorical code for the Domain. If not provided, all rows will be treated as one domain.
A transform file is created for each Domain specified. File names are automatically labelled using the domain as a suffix.
Weight Field
The Weight Field column displays the declustering weight value for each domain. If domains are not provided, the option is enabled to select a single column of weights.
Auto calculate
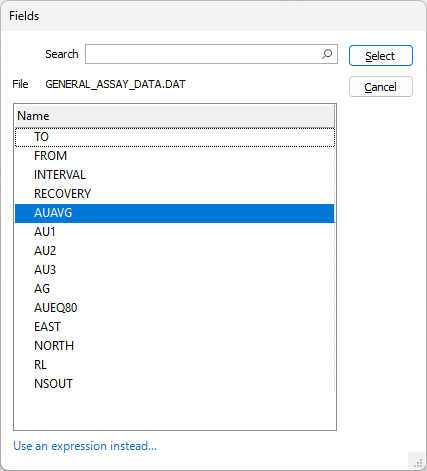
If you click the Auto calculate button, the Domains grid will be automatically filled with the existing domains in the Input file. You can add the Weight Field values using the list button for each domain.
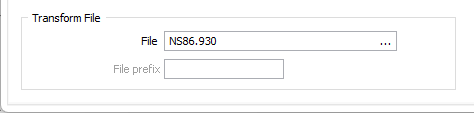
Transform File
The Transform File options are used to configure the output transform file that will be created by the Normal Scores process.
File
Where no Domains have been configured, you can specify a Transform File to write to in the File field.
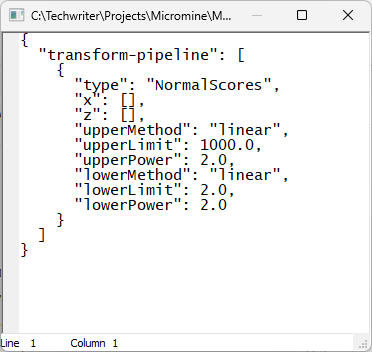
If you right click the File field with a transform file selected, the file will be opened for viewing (note it cannot be edited):
File prefix
Optionally enter a File prefix for automatically labelling output file names.
Options
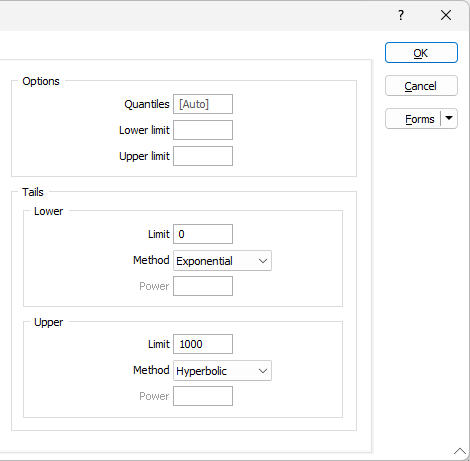
The fields in the Options group are used to set the number of quantiles for the process, as well as the upper and lower limits.
Quantiles
Enter the number of quantiles to be used to calculate the normal scores.
Quantiles are values extracted at regular intervals from a dataset that has been sorted into increasing order. Calculating quantiles involves dividing the sorted data into equal-sized subsets and then identifying the values at the boundaries between subsets. Quartiles are useful for summarising and comparing data and have the advantage of being less susceptible to outliers than the mean.
For example, dividing a sorted dataset into four quantiles (which are then referred to as quartiles) will split it into groups that each contain 25% of the data. The data value at the boundary between the first and second group is known as the first quartile, and it represents the point below which 25% of the data occurs. The second quartile, also known as the median, has 50% of the data below it, the third 75%, and the fourth 100%.
Lower limit
Enter the Lower limit value below which data for the transformation will be clamped.
Upper limit
Enter the Upper limit value above which data will be clamped for the purposes of transformation.
Tails
The tails of the Normal Scores data represent the upper and lower limits of the estimation. The calculation method selected for tails can have a significant influence on outlier values.
The Upper and Lower options in the Tails group determine how values outside the specified range of data are back transformed.
Lower
Enter the Lower Limit for the tail modelling in the field provided. Limits you set control how values outside the range of data are back transformed.
Use the Method drop down to select a calculation method for the transformation - Linear, Poweror Exponential. If the Power method is selected, you can define a power. The default power is 2.
Back transformed values will be clipped at the Upper and lower back transform limits.
Upper
Enter the Upper Limit for the tail modelling in the field provided. Limits you set control how values outside the range of data are back transformed.
Use the Method drop down to select a calculation method for the transformation - Linear, Power, Exponential or Hyperbolic. If the Power method is selected, you can define a power. The default power is 2.
Back transformed values will be clipped at the Upper and lower back transform limits.
Finally. click OK to generate the chart. See: Chart | Normal Scores Transform