

Chart | Normal Scores Transform
The Chart | Normal Scores Transform window displays the normal scores for each Domain configured.
The following is an example of the displayed transformation:
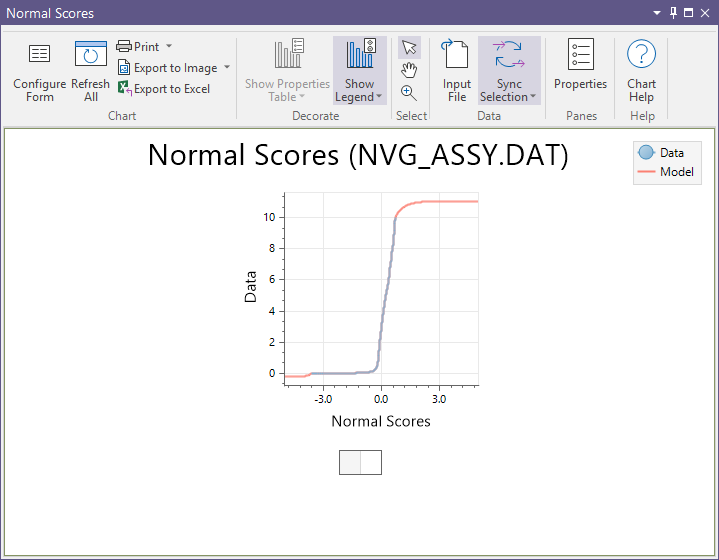
The transformation model series is displayed in a range between -5 to 5 in normal scores space, showing the back-transformed values on the Y-axis. The Data is displayed separately from the Model; and the model features Tails on the data.
When you generate a chart, many of the tools and options on the Chart ribbon are common to most charts. See: Chart Tools
To make changes to the display and other information for the chart, use the Configure Form tool to open the Normal Scores Transform form and make the required changes.
You can use the Select, Zoom and Pan tools on the Chart toolbar to examine the domains of interest.
Click the Chart Help button for more information on configuring Charts.