Validation
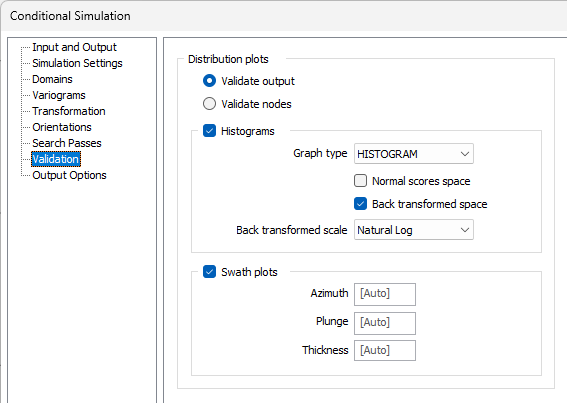
The Validation tab of the Conditional Simulation form is used to configure validation for distribution plots, specify the maximum nodes for optional Variography and autoload a block model or define a comparison model to autoload.
Users can quite easily run simulations that don’t honour the spatial continuity observed. The Validation options provide charting capability that allows you to verify simulated data
.
Distribution plots
The validation options in the Distribution plots group are used to select whether to validate the output or the nodes, as well as enable Histograms and/or Swath plots for the distribution plot validation.
Validate output / Validate nodes
Select whether to validate the distribution plot output or the variogram nodes.
If discretisation is enabled (with an output file), you can select Validate nodes to target nodes in the outputs for Histograms, Swath Plots, and autoloaded E-Type. If you select Validate output, the output blocks will be used for validation.
Histograms
If you select Histograms, a chart (for each domain/attribute combination) will be produced using the graph type selected.
Graph Type
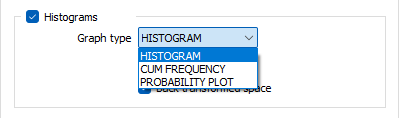
Select the required Graph Type from the drop down list:
Normal scores space
Select the Normal scores space option if you want the validation process applied to the Histogram normal-score output.
The sample mean and variance should be reproduced by realisations. In normal score space, the histogram of realisations should be N(0, 1). The (upper) tail should be reproduced, with an ability to see normal-score vs back-transformed plots to see if the upper tail model produced by the Normal Scores Transform tool is working correctly.
Back transformed space
Select the Back transformed space option if you want validation applied to the Histogram back-transformed output.
Back transformed scale
Select whether to apply Linear or Log Normal scaling to the transformation:
- LINEAR scale displays the actual values for the Graph field subject to the settings in Numeric Exceptions.
- NATURAL LOG scale displays values from the Graph field converted into their natural logarithm.
Swath plots
Select the Swath plots option to output a chart per domain/attribute. By default ([Auto]) the azimuth and plunge will be determined from the block model, and thickness is 2*min(x, y, z), where (x, y, z) is the main block size.
Specify the Azimuth, Plunge and Thickness values for trend validation. This validation will compare (back-transformed) realisations vs. input along the major axes. Realisations should follow the line of the input data, or local trends are not being respected.
By default ([Auto]), the Azimuth and Plunge will be determined from the block model, and the Thickness is 2*min(x, y, z), where (x, y, z) is the main block size.
Variography
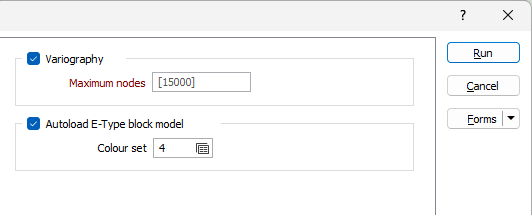
Where a Nodes file has been specified in the Discretisation options, you can select the Variography option to create variograms per domain/attribute combination.
Experimental variograms can be produced for each realisation of (a random sub-sample, size 10-50k, of) simulated nodes and visualised on the model/theoretical variogram in the normal-score space. For validation, realisation variograms should fluctuate around the model.
Maximum nodes
Specify the maximum number of randomly selected nodes to use for each realisation (with a hardcoded seed).
Autoload E-Type block model
Select the Autoload E-Type block model option to automatically display the resultant e-type block model in Vizex. This option is only enabled when Mean (E-Type) summary is selected on the Output Options tab.
Colour set
To map values in the Colour field to the colour values in a Colour set, double click (F3) to select the set that will be used to control the display colour. Right-click (F4) to create or edit a Colour set.
Run Validation
The Run Validation button for the form will create validation charts on existing information in the block model without needing to re-run the simulation in order to perform validation. Validation will check that all expected realisation fields in the block models are present, make sure the transform file can be found, and perform other checks against the previously run simulation.
Note: Changes can be made to the Validation controls before using Run Validation. However, any changes to other parameters (such as search pass, transform file, etc.) will disable the Run Validation button. Validation charts are populated on the previously run simulation, and cannot consider any updated data.