

Search Passes
The Search Passes tab is used to configure one or more search passes for the estimation by specifying the Radius and Axis factor information for each pass.
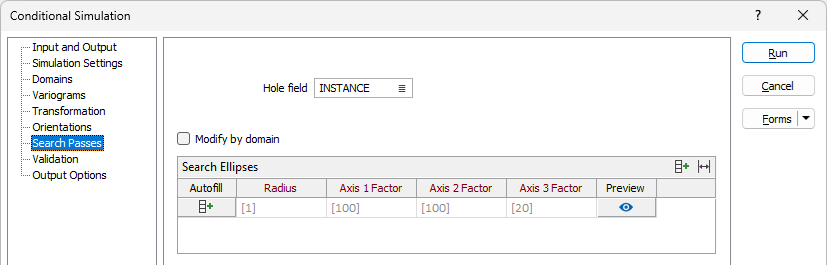
Optionally, specify the Hole field for the search using the field provided.
If you select the Modify by domain option, each search pass will be performed for each domain.
Search Ellipses
The Search Ellipses grid displays the details for each search Pass to be performed. If you click the Autofill button in the grid title bar, the Autofill Search Passes form is displayed:
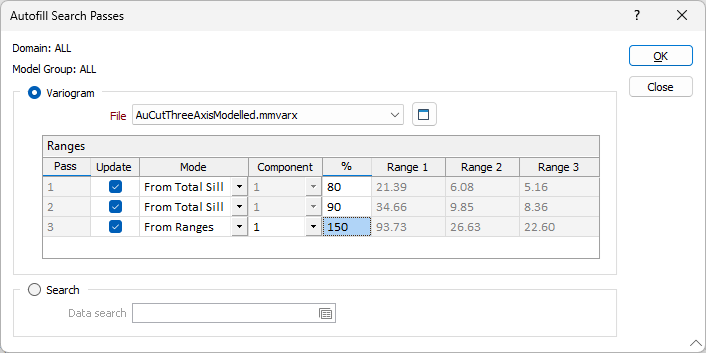
Note: This method will fill all domains and model groups with the configured search pass settings. To autofill each pass individually, use the Autofill button on each row of the Search Ellipses grid.
-
Select the Variogram option to select a variogram File for the search ellipses.
-
Use the Ranges grid to define the Mode and % for each Pass.
Note: From Ranges mode allows values greater than 100% to be calculated, while From Total Sill must be no more than 100% for the top of the total sill.
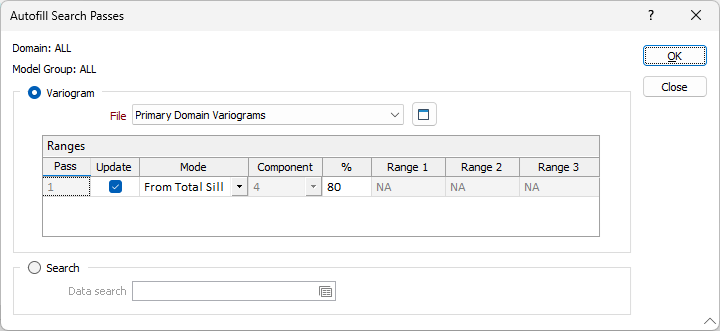
Alternatively, you can select the Search option and use the field provided to select a Search Definition form to fill the Ellipses Grid.
-
Click OK to fill the Search Ellipses grid.
For each search pass instance listed in the Search Ellipses grid, the Radius and Axis Factor information is populated from the values for each Domain. You can automatically populate the fields for each Pass by clicking the Autofill button for the pass and using the Autofill Search Passes as previously outlined. Alternatively, you can edit any values directly, as required.
Search Criteria
The Search Criteria grid is populated with the same Method, Attribute, Output Field and Model Group information for each Domain / search pass as the Search Ellipses grid.

For each search pass instance, you can configure the Min and Max total samples for the information contained within the search criteria.
Sectors
The Sectors fields in the Search Criteria grid are used to define the Search Criteria Mode, Min Total and Min and Max Samples values for each Model Group and Pass.
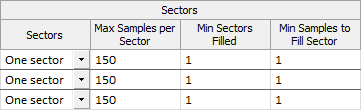
Use the Mode drop down to select the number of sectors for the search parameters for each model group / pass.
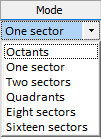
For information on sectors in search parameters, see: Search Definition.
For each chosen Mode for the Search Criteria, you can accept the default values or enter the following:
Min Total
Enter a value for the minimum number of points to be applied across all sectors.
Min Samples
Enter the minimum number of samples to be applied per sector.
Max Samples
Enter the maximum samples to be applied per sector. This value is multiplied by the number of sectors to determine how many data sample points can be used within the overall search shape.
Holes
If a Hole field has been defined for the Search Passes information, the Holes section of the grid is displayed.
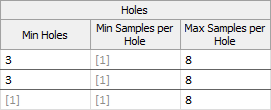
For each Domain / Search Pass for the interpolation, the minimum total, minimum points and maximum points details for the Hole are displayed. You can accept the default values or configure the following:
Min Total
Enter a value for the minimum number of points to be applied across all holes.
Min Samples
Enter the minimum number of samples to be applied per hole.
Max Samples
Enter the maximum samples to be applied per hole. This value is multiplied by the number of holes to determine how many sample points can be used within the overall search shape.
Simulated Nodes
The Simulated Nodes fields in the Search Criteria grid are used to define the maximum nodes and inclusion probability criteria Pass.
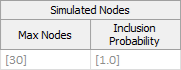
Max Nodes
The maximum number of simulated nodes to be included in the kriged estimate.
Inclusion Probability
Enter the probability of inclusion value for the search criteria. This value defaults to 1.0, meaning that all of the nearest nodes (up to Max Nodes) will be included in the kriged estimate used to obtain the conditional distribution. Setting this value to less than 1.0 (and greater than 0) will mean that some of the nearest simulated nodes will be overlooked.
Inclusion probability is most useful when the simulation grid is much denser than the sample spacing, or when ranges are long relative to node spacing. This is because selecting only the closest nodes can become extremely local.
Column widths in grids across the tabs are resizable to allow custom layout of the information. You can revert any changes made to the column widths with the Reset Column Widths button in the toolbar.