

Targets Dashboard
On the Services ribbon, click Dashboard to manage your dashboards. A dashboard is a collection of one or more panels suitable for display on a large screen.

With the Dashboard module displayed,
-
Click the Targets Dashboard option in the header panel.
The Targets Dashboards screen is displayed.
You can select a dashboard to view from a list of the available dashboards using the Dashboard drop down.

Selecting the My Dashboards check box will add any dashboards you have created with the Designer to the list of available dashboards to view/edit.
To open a Dashboard, from the Targets Dashboard screen,
-
Select the dashboard you want to view from the Dashboard drop down at the top left.
The selected dashboard is opened.
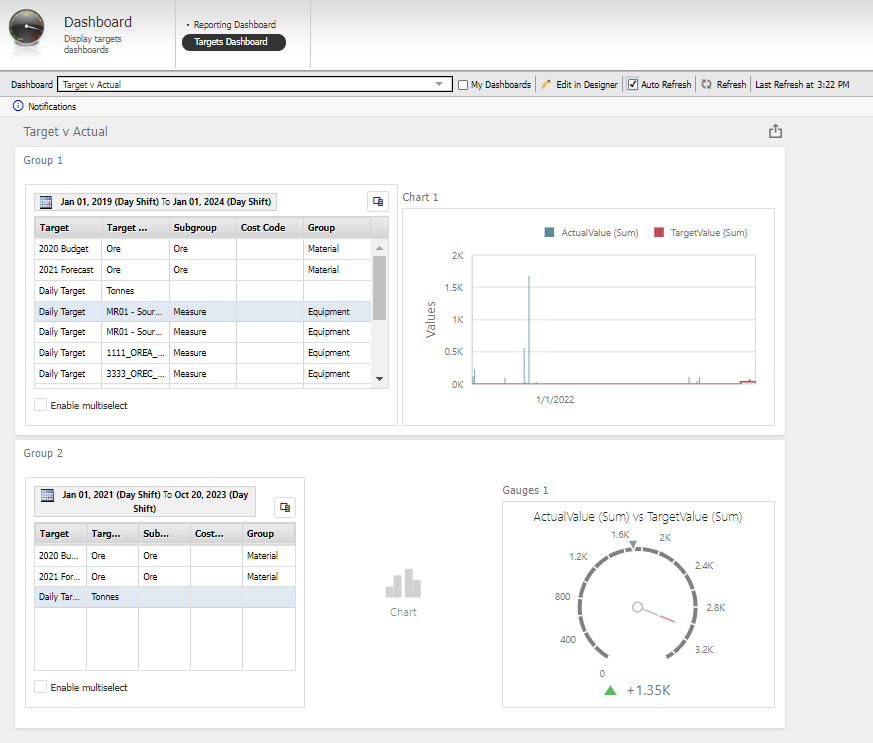
The Shift Roster is displayed at the top of relevant widgets and is used to select the applicable shift roster.
The Auto Refresh option, when selected, will automatically refresh the data displayed in the dashboard at the default interval of 3 minutes. This setting can be overridden by your Micromine Pitram configuration - contact Support if required.
Note: Auto refresh is only enabled:
-
In Viewer mode
-
If Auto Refresh is selected
-
It is not currently updating data (refresh is disabled while this is in progress)
-
There has not been any user interaction activity for 2 minutes (i.e. no mouse movement or keystrokes). Refresh is not required while a user is performing any interaction.
The Refresh button can be used to manually refresh the data displayed in the dashboard.
The Last Refresh at information indicates the time at which the displayed data was last refreshed, either automatcially or manually.
If you have write access to the dashboard, the Edit in Designer button is enabled.
To edit the selected dashboard,
-
Click Edit in Designer.
The Targets Dashboard is opened in Designer view.
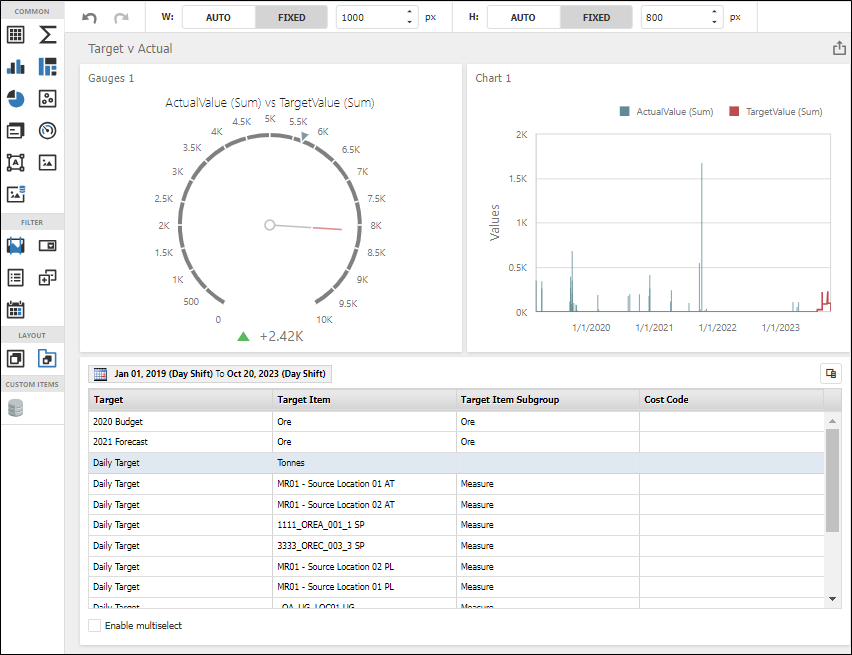
You can modify the size of the dashboard using the menu at the top of the designer:

The panels at the left of the design window contains buttons that are used to add and configure widgets to be placed on the dashboard.
The widgets added to the dashboard are displayed on the right in a grid layout. The layout is changed dynamically when adding or removing widgets from the dashboard.
Groups can be created on the dashboard to contain widgets bound to separate data sources - see Create Data Groups.
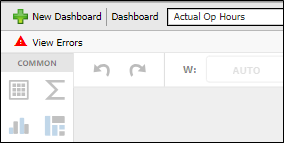
If any errors exist in the dashboards you create, a message will appear in the toolbar:
Clicking the error message will open up the Errors details pane.
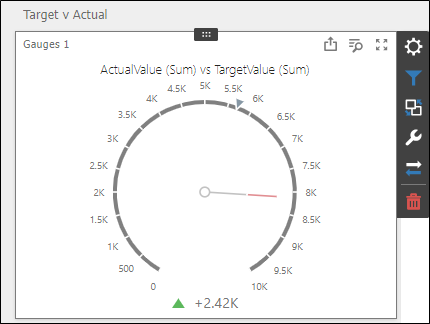
If you select a widget on the dashboard in editing mode, a number of buttons and tools become available for that widget:
For information on the available widgets and editing or creating a dashboard, see Managing Targets Dashboards.