

Dashboards Service
On the Services ribbon, click Dashboard to manage your dashboards. A dashboard is a collection of one or more panels suitable for display on a large screen.

The Dashboard module provides access to viewing and editing two dashboard types.
-
Reporting Dashboard - View and manage graphical reports based on the information in your database such as Equipment Hours and Location Status
-
Targets Dashboard - View and manage analytic dashboards bound to a filtered data source for target analysis.
Reporting Dashboard
Each dashboard panel contains items that may be based on:
- Views that have been configured as a data grid or as charts in the Data Browser
- Reports that have been generated using a specified output format (e.g. Crystal Reports, HTML, PDF)
- Web pages
- Any document or image that can be accessed via a URL
A dashboard can be configured to display a number of panels. Each item in the dashboard is displayed dynamically. The rate at which a item is refreshed or updated can be defined by the user.
An item, linked to the stock market Web page which regularly updates the commodity prices is a good example of a dynamic display. An item can be based on a report query or on a URL.
Dashboards are suited to large screen displays to keep a wide audience informed of the current state of operations on site, for example equipment locations and states and equipment allocation.
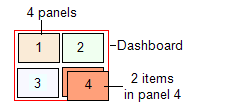
Access the Dashboard
The Dashboard window comprises two panes. They are the:
- Left pane. A user with Administrator rights has access to two areas on this pane:
- Configuration. Here the Administrator defines each available dashboard. The configuration takes place on the right pane. This includes the dashboard name, the connection, number of panels, rotation rate and the refresh rate.
This option is only available to users with an Administrator role
- Dashboards. All users have access to the list of currently defined dashboards. Select a dashboard to launch the display.
- Configuration. Here the Administrator defines each available dashboard. The configuration takes place on the right pane. This includes the dashboard name, the connection, number of panels, rotation rate and the refresh rate.
- Right pane. The currently defined dashboards appear with the dashboard icon and name. Click on a name or icon to launch the dashboard display.
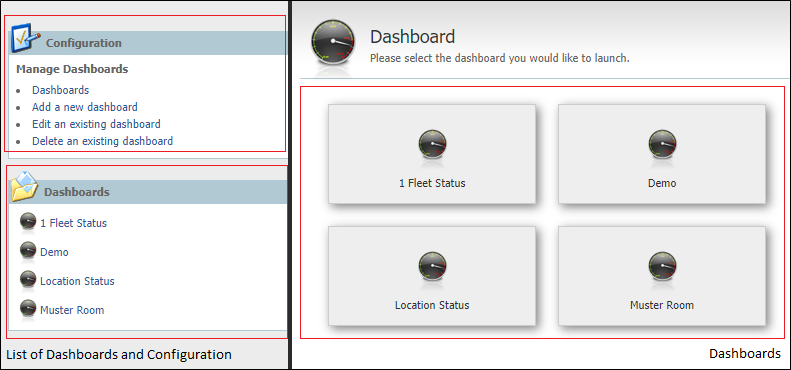
Launch a Dashboard
On the left pane, a number of dashboards are listed for you to launch:
- For example, select the Equipment Availability by Period dashboard at the top of the list. The right pane will present a summary of the selected report definition listed under:
- Included Reports. Here you will find the number of panels defined in the dashboard, and the report name and the query name on which any reports are based.
- Comments. The comments added when the dashboard was defined.
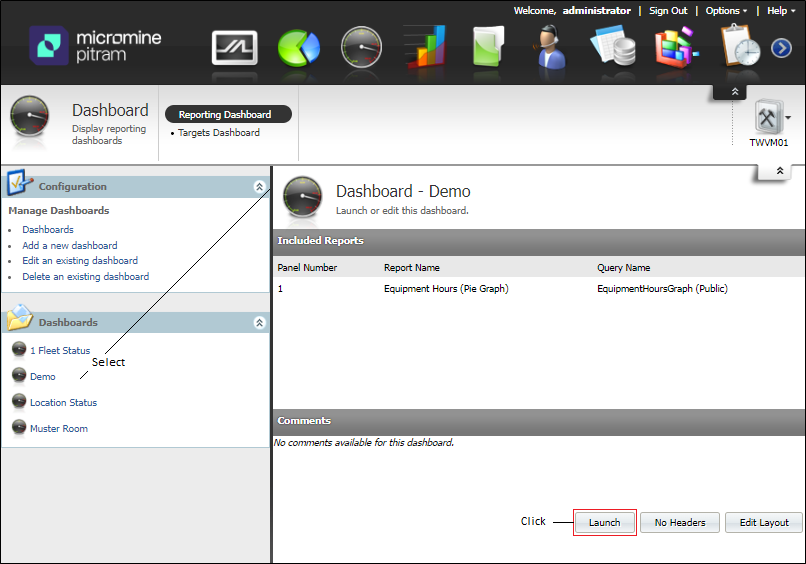
- Click the Launch button at the bottom-right of the right pane.
- When the launch has completed the dashboard will open. The dashboard is periodically refreshed, with the refresh interval set in the dashboard definition. Each refresh accesses the database or URL to collect and presents the most up to date information.
- Click the Close button
 on the upper-right of the panel.
Launch Options
On the right pane, the following launch options are available:
- Launch. Click to launch the selected dashboard. The dashboard will be displayed with the layout and items you have defined.
- No Headers. By default, each item has a header, which displays the report or link name and the current date and time. When you select this option, the headers are deleted from the items, leaving more room on the panel for each of the items.
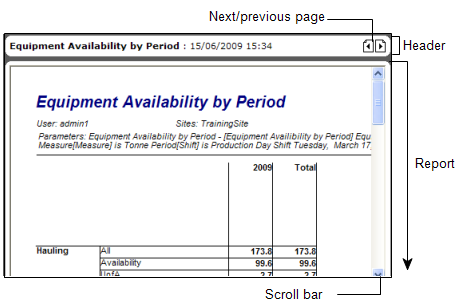
- Edit Layout. To edit the panel width if more than one panel is defined in the dashboard. At the top right or left of a panel click the black triangle to adjust its width.