

Managing Targets Dashboards
To create, edit or delete a Targets dashboard
-
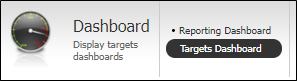
Select the Dashboard icon on the service bar.

-
Select the Targets Dashboards option.
Creating a dashboard
To create a dashboard:
-
Click the Edit in Designer option in the menu bar to open the designer.
-
Click New Dashboard at the top left.

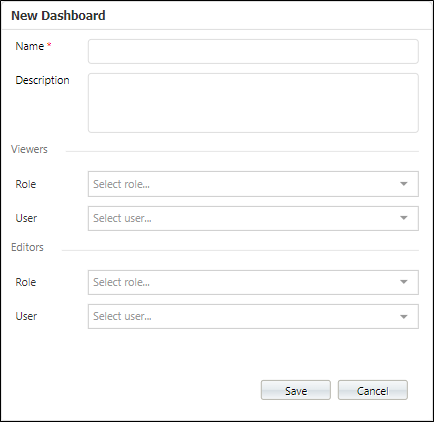
The New Dashboard form is displayed.
-
Enter a name for the new dashboard in the Name field.
-
The Description field can optionally be used to enter more detailed text on the purpose of the dashboard.
In the Viewers section of the form,
-
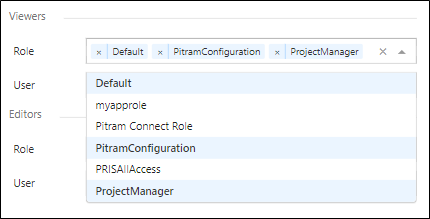
Select the user Role which applies to the users who will have Read access to the dashboard you are creating.
You can select more than one Role from the list of available user roles.
-
From the User drop down, select individual users to be granted Read access to the dashboard.
In the Editors section of the form,
-
Select the user Role or roles for the users who will have Write access to the dashboard you are creating.
-
From the User drop down, select individual users to be granted Write access to the dashboard.
-
Click Save to commit the details for the new dashboard.
A new, empty dashboard with your configured Name as the default label in the header is displayed.
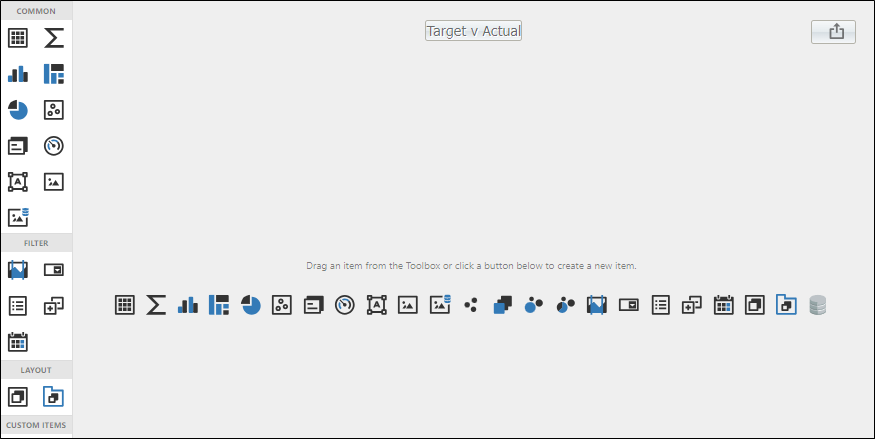
Before adding widgets to a dashboard to display your data, the first step should be to configure access to the database/s containing the data to be queried.
-
You can click the Dashboard Menu button and select Data Sources to view the data sources available to your dashboard.
By default, all widgets on the dashboard are bound to a single data source. You can create multiple Layout Groups containing widgets that can be bound to separate data sources. For information on using multiple data sources, see Create Data Groups.
With a data source added, the Data Sources page displays the Used Data Sources for the dashboard in the panel at the left.
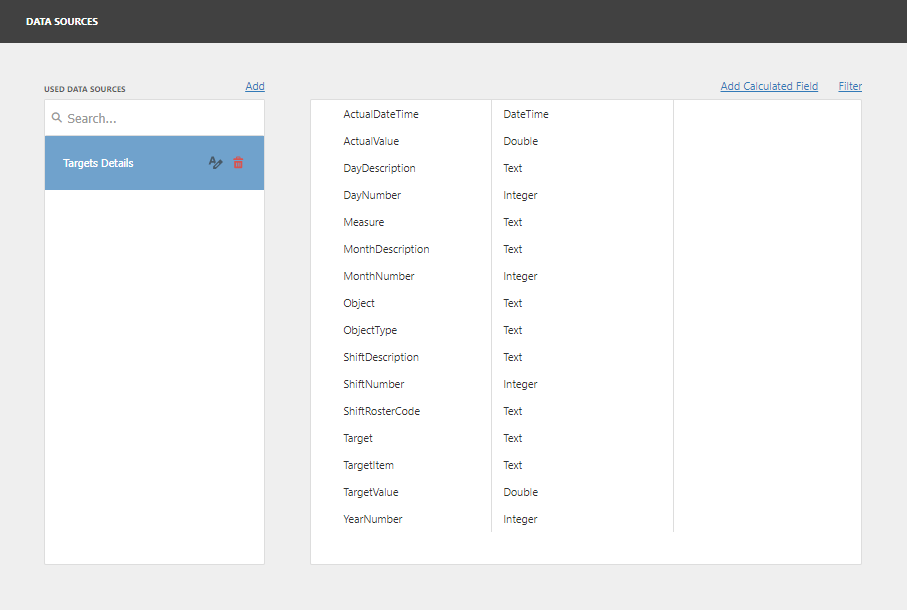
If you select a data source in the left-hand panel, you can view the available fields and their type - for example ActualDateTime is a DateTime field.
You can add data sources from this screen using the Add option at the top of the Used Data Sources panel.
The Add Calculated Field option above the last panel is used to create calculated fields using expressions with the data fields in the data source.
Information on creating and using Calculated Fields is contained on the Dev Express End-User site via the link.
If you want to rename a data source for the dashboard,
-
Hover on the label in the Used Data Sources panel and click the Edit icon.
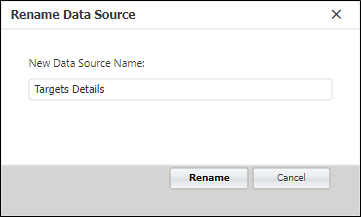
The Rename Data Source form opens.
-
You can edit the data source name directly in the field provided and click Rename.
To delete a Data Source from the dashboard,
-
Hover on the label in the Used Data Sources and click the Delete icon.
To close the Data Sources page,
-
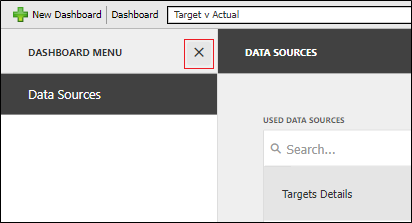
Click the cross for the Dashboard Menu at the left of the page.
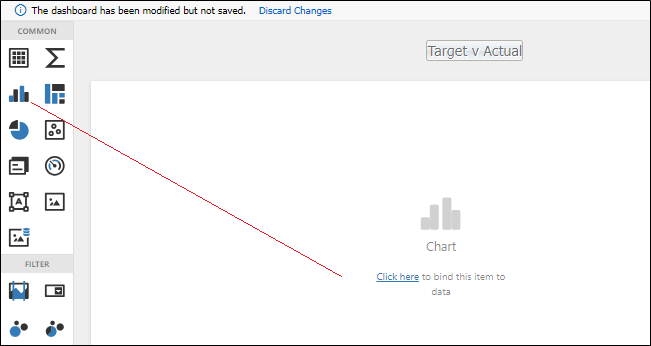
The icons in the panels at the left of the designer are used to place a widget on the dashboard.
-
If you drag and drop a widget, it will appear in the screen at the right.
For example, the Chart widget was placed on the dashboard shown here:
The available widgets are outlined in Targets Dashboard Widgets.
Each widget you add to the dashboard needs to bound to one of the data sources you have added in order to display the required information. The caption below the widget symbol on the dashboard contains a link to the Data Binding options.
-
Click the Click here link to open the Binding options for the widget.
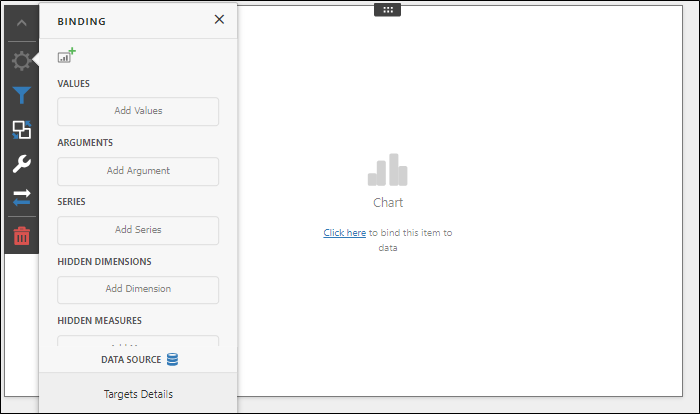
The data source for the widget is displayed at the bottom of the Binding options menu.
-
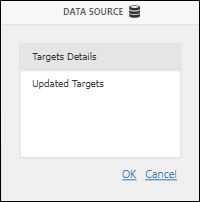
You can change the Data Source, if required, by clicking the label.
The menu is expanded to display the list of available data sources.
-
Select the required data source and click OK.
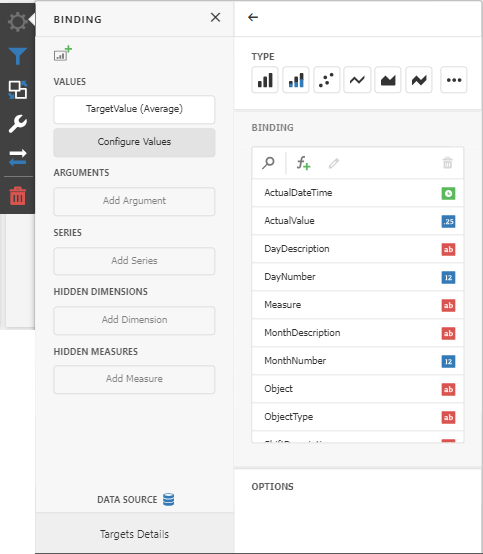
The Binding options available are specific to each widget. The Chart widget, for example, lets you set the chart type and the columns for the chart from the Configure Values button:
Information on binding data to widgets is available online from the Dev Express End-User site via the link.
When your widget is configured as required, the data it represents will be displayed on the dashboard. You can add more widgets as needed and users with access will be able to view and/or edit the dashboard.
To save the dashboard at any stage, use the Save button in the dashboard toolbar.
The dashboard you are creating can be previewed using the Switch To Viewer button in the toolbar.
In Viewer mode, the Auto Refresh option is available. When selected, the data in the dashboard will be automatically refreshed according to the interval set within the application (a default time of 3 minutes). When the option is not selected, the data can be refreshed manually using the Refresh button. The date and time at which the data was last refreshed is displayed alongside the Refresh options.

Editing a dashboard
You can edit dashboard details after creating a dashboard:
-
Click Edit in the dashboard toolbar.
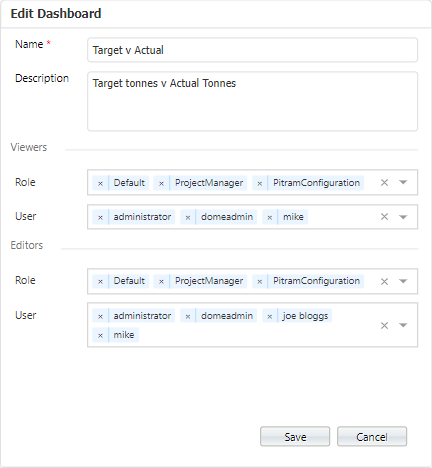
The Edit Dashboard form opens.
-
If required, change the details in the displayed fields.
- Click Save to retain the changes to the dashboard.
For each individual widget, filters and other options can be configured using the widget menu.
-
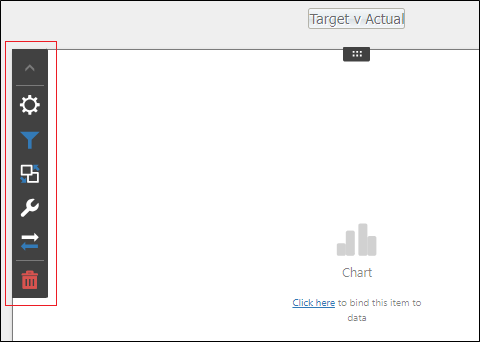
Hover on the widget in design mode to view the menu.
-
The Binding option opens the Binding panel used to bind the widget to your data sources, as outlined previously.
-
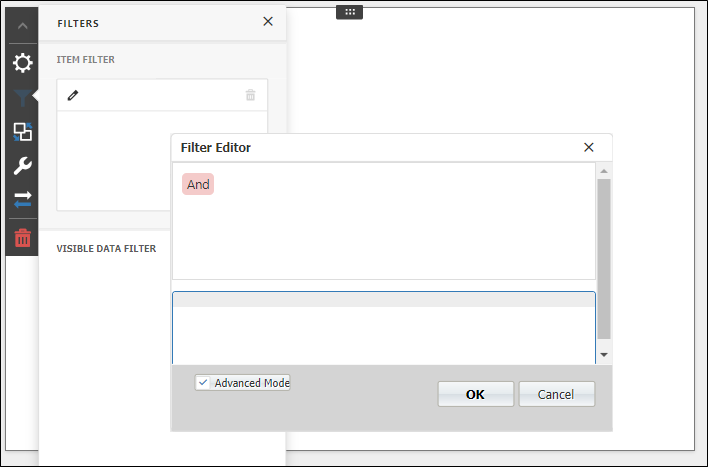
Using the Filter button on the menu, filters for the data bound to the widget can be configured using regular expressions.
-
The Interactivity option opens the Interactivity panel used to configure the interaction between the widget and other items on the dashboard.
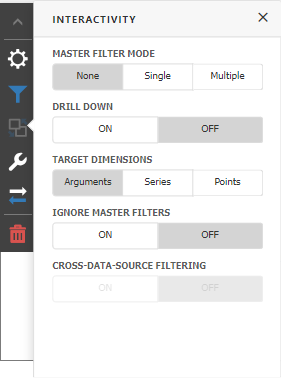
Interactivity options will vary for each available widget. More information on interactivity is contained on the Dev Express End-User page via the link.
-
The Options button on the menu opens the Options panel from which you can configure settings for the widget such as captions, formatting and more.
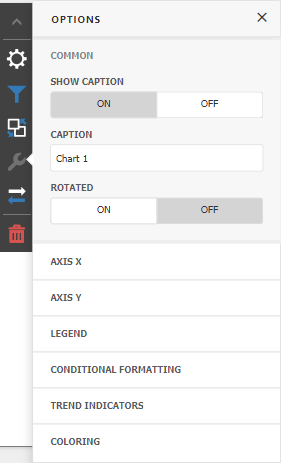
The available options will vary according to the selected widget. More information on widget options is contained on the Dev Express End-User page via the link.
-
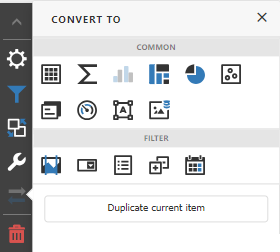
The Convert To button on the menu opens the Convert To panel from which you can convert the selected widget to a different type - such as from a chart to a map, a filter or a different chart type.
-
The Delete button on the menu can be used to delete the selected widget.
Note: Deleting a widget will remove it from the dashboard permanently.
Exporting a dashboard
If you click the Export To button at the top right of the dashboard design window, you can export the information in your dashboard in various formats.
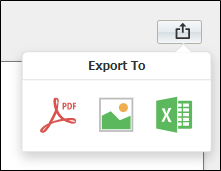
The available export formats are:
-
PDF (.pdf)
-
Image (.png, .gif, .jpg)
-
Excel (.xlsx)
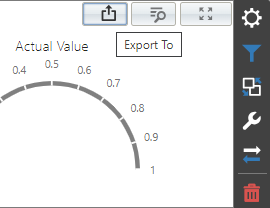
Information from individual widgets can also be exported by selecting a widget on the dashboard and clicking the Export To button.
Information on exporting dashboards is contained online at the Dev Express End-User site via the link.
Deleting a dashboard
To delete a dashboard:
- Click Delete in the dashboard toolbar.
-
Click OK to confirm the deletion.
Note: If you delete a dashboard, it is permanently removed as there is no undo facility.