Asset Health Widget Types
On the Services ribbon, click Asset Health to display the dashboards showing the performance against the reading definitions you have configured for your assets.
Widgets added to the Asset Health dashboards you create display information on various states and values for configured equipment.
The following kinds of widgets can be added to the dashboard:
Selection
-
Equipment - Provides a list of Equipment used to dynamically display selected equipment in the widgets on or added to the dashboard.
Reading Values
- Line Chart - Displays a line chart for a selected Reading and Equipment unit.
-
Readings - Displays a table containing a simple snapshot of the current readings for the Equipment unit.
-
Circular Gauge - Displays the current value of a selected reading in a gauge format - e.g. Engine Oil Temperature.
-
Linear Gauge - Displays the current value of a selected reading in a linear format.
Alarms
-
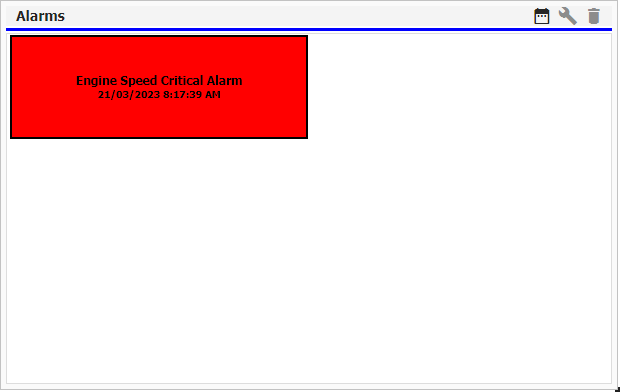
Alarms Grid - Displays any triggered Alarms for a selected Equipment unit.
-
Bulb Gauge - Displays the current status of one or more selected alarms.
-
Status Map - Provides an alternative view to the Bulb Gauge and can be used to display the current status of alarms.
Equipment
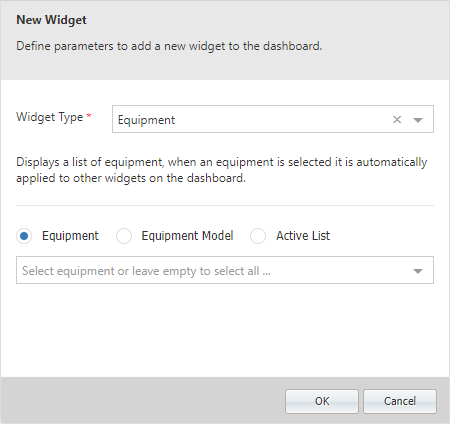
With Equipment selected from the Widget Type drop down,
-
Select whether to display Equipment, Equipment Model or an Active List.
-
Optionally select specific Equipment, Equipment Models or Active Lists from the drop down, or leave it empty to select all from the selected option.
-
Click OK to save the new widget and add it to the selected dashboard.
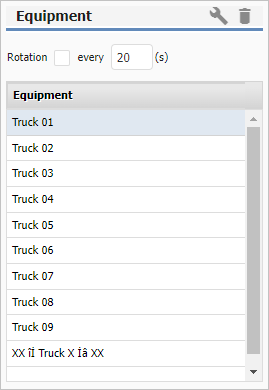
Once you have other widgets configured on the dashboard,
-
Select equipment from the Equipment widget to automatically display the details of that equipment in the other widgets - as shown in the example below.
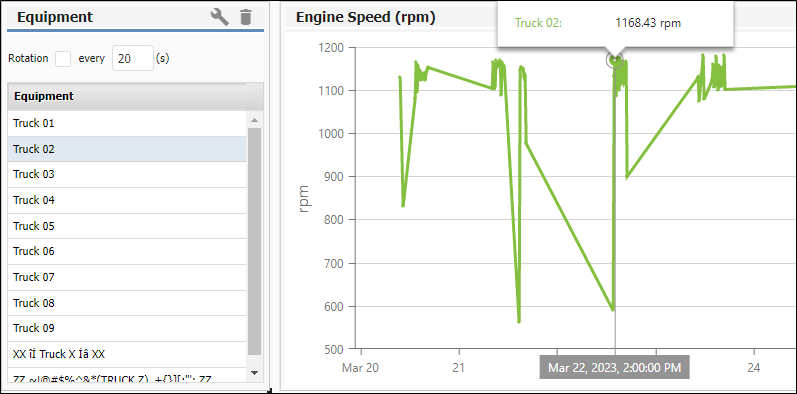
If you select the Rotation check box in the Equipment widget, and enter an interval (in seconds) in the field provided, the information displayed in other widgets will "rotate" through the Equipment in the list at the set interval. If you manually select equipment, the Rotation settings are disabled. Click Rotation to reapply them.
Note: If you have an Equipment selection widget added to the dashboard, you will not need to select equipment for the other widgets. This means Equipment selection will be disabled for configuring new or existing widgets as long as the Equipment selection widget is active on the dashboard.
Line Chart
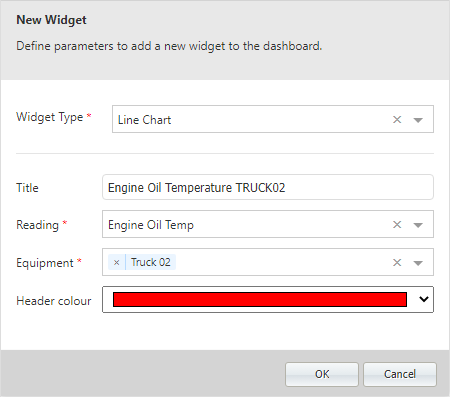
With Line Chart selected from the Widget Type drop down in the New Widget form,
-
Enter a name for the widget in the Title field.
-
Use the Reading drop down to select the Reading Definition to be used for the widget.
-
Select the Equipment for the widget from the drop down.
-
Use the Header Colour drop down to select a custom colour for the widget header. This is useful to enable the identification of individual widgets at a glance.
-
Click OK to save the new widget and add it to the selected dashboard.
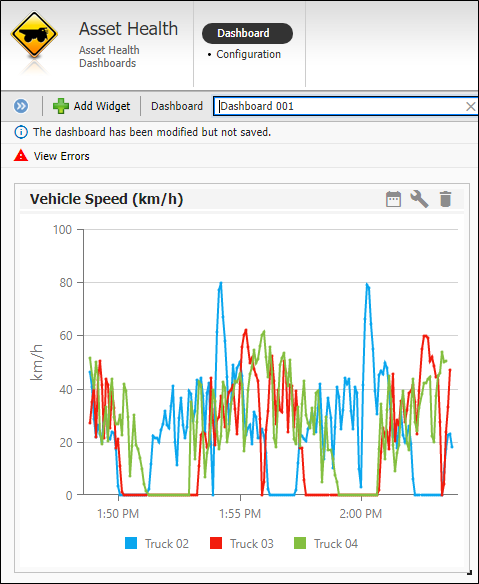
Multiple equipment units can be selected for the Line Chart widget.
Readings
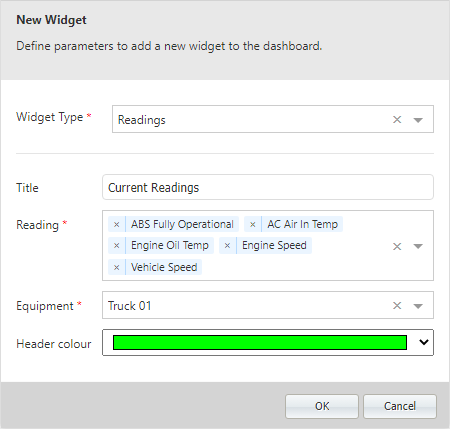
With Readings selected from the Widget Type drop down in the New Widget form,
-
Enter a name for the widget in the Title field.
-
Use the Reading drop down to select the Reading Definition to be used for the widget.
-
Select the Equipment for the widget from the drop down.
-
Use the Header Colour drop down to select a custom colour for the widget header. This is useful to enable the identification of individual widgets at a glance.
-
Click OK to save the new widget and add it to the selected dashboard.
Multiple readings can be selected for the Readings widget.
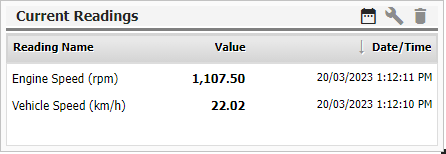
The widget you created is displayed in the dashboard. You can resize the widget using the control in the bottom right corner. Scroll bars to view all of the available information in the widget will be automatically added to grid style widgets if the size is too small.
Circular Gauge
The Circular Gauge widget displays the current value of a selected reading in a gauge format - e.g. Engine Oil Temperature.
With Circular Gauge selected from the Widget Type drop down in the New Widget form,
-
Enter a name for the widget in the Title field.
-
Use the Reading drop down to select the Reading Definition to be used for the widget.
-
Select the Equipment for the widget from the drop down.
-
Use the Start value and End value fields to enter the values at which the gauge widget starts and ends - for example Start 0 to End: 180 for a common speedometer.
-
The Interval field is used to enter the displayed increment for the values on the gauge widget.
-
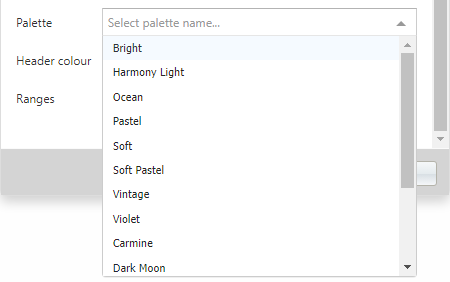
The Palette drop down is used to select the colour palette to be used for the display of the widget. There a number of palettes included.
-
Use the Header Colour drop down to select a custom colour for the widget header. This is useful to enable the identification of individual widgets at a glance.
-
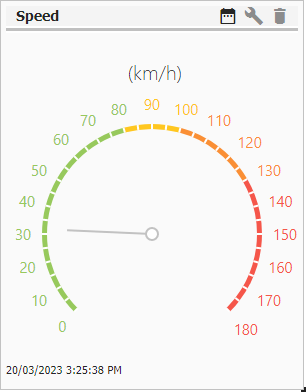
The Ranges fields are used to configure a single or multiple range for the gauge widget within the Start and End Values.
If you enter a start value in the left cell and an end value in the right cell, colours from the selected palette will be used to indicate the range entered.
Clicking the Plus button will create a new set of Ranges fields that you can use to enter another range.

This range will be indicated by a different colour. You can repeat this process to create a series of ranges within the gauge display - as shown:
-
Click OK to save the new widget and add it to the selected dashboard.
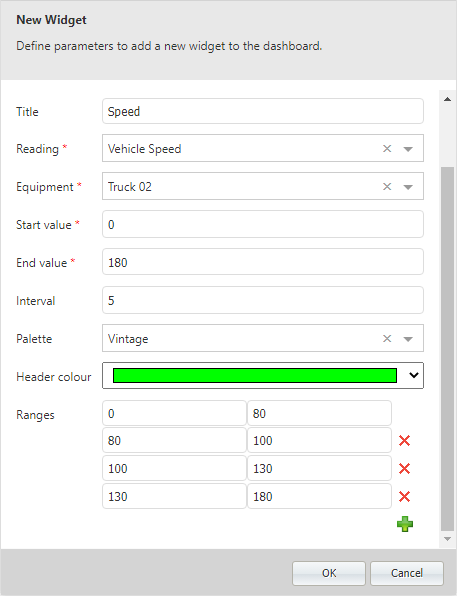
The widget you created is displayed in the dashboard. You can resize the widget using the control in the bottom right corner. Scroll bars to view all of the available information in the widget will be automatically added to grid style widgets if the size is too small.
Linear Gauge
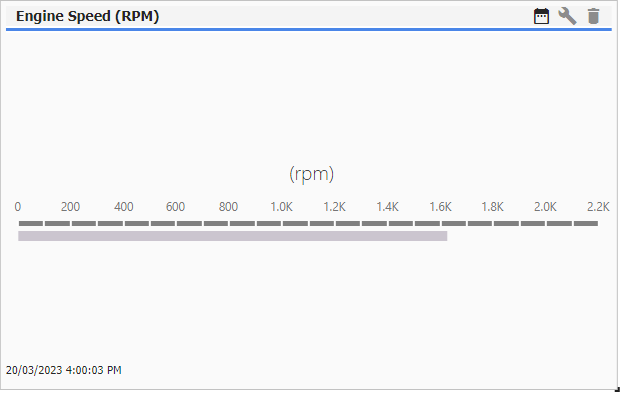
The Linear Gauge widget displays the current value of a selected reading in a linear format.
With Linear Gauge selected from the Widget Type drop down in the New Widget form,
-
Enter a name for the widget in the Title field.
-
Use the Reading drop down to select the Reading Definition to be used for the widget.
-
Select the Equipment for the widget from the drop down.
-
Use the Start value and End value fields to enter the values at which the gauge widget starts and ends - for example Start 0 to End: 180 for a common speedometer.
-
The Interval field is used to enter the displayed increment for the values on the gauge widget.
-
Use the Orientation drop down to select the format for the information displayed - Horizontal or Vertical.
-
Use the Header Colour drop down to select a custom colour for the widget header. This is useful to enable the identification of individual widgets at a glance.
-
Click OK to save the new widget and add it to the selected dashboard.
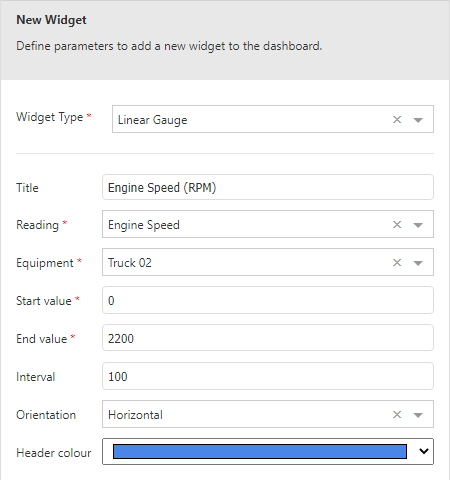
The widget you created is displayed in the dashboard. You can resize the widget using the control in the bottom right corner. Scroll bars to view all of the available information in the widget will be automatically added to grid style widgets if the size is too small.
Alarms Grid
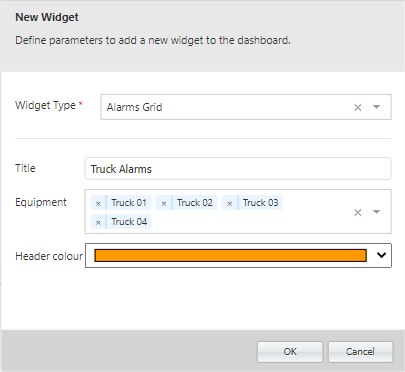
With Alarms Grid selected from the Widget Type drop down in the New Widget form,
-
Enter a name for the widget in the Title field.
-
Select the Equipment for the widget from the drop down.
-
Click OK to save the new widget and add it to the selected dashboard.
The widget you created is displayed in the dashboard. You can resize the widget using the control in the bottom right corner. Scroll bars to view all of the available information in the widget will be automatically added to grid style widgets if the size is too small.
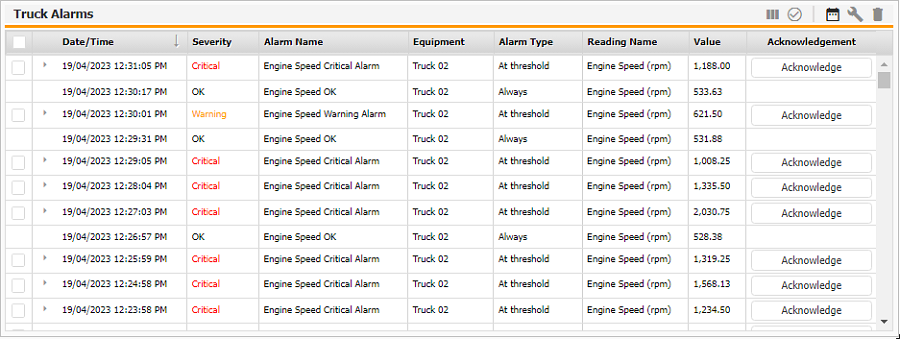
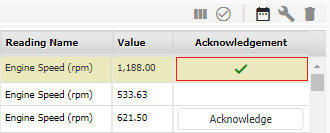
Alarms requiring acknowledgement which appear in the Alarms Grid can be acknowledged directly from the widget on the dashboard.
-
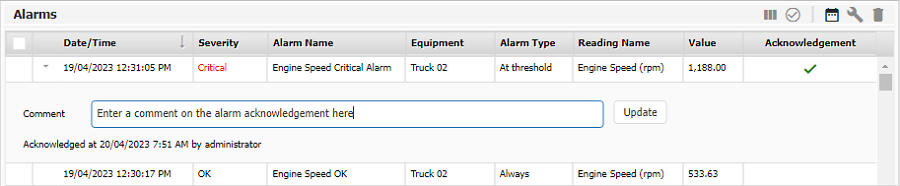
If a user clicks an Acknowledge button for an alarm, a check mark will appear and the alarm is acknowledged.
-
On clicking the check mark, a Comment panel will be available with a date, time and user label for the acknowledgement:
-
You can enter a comment on the acknowledgement and click Update to retain it against the alarm.
-
The check mark can be used to toggle the Comment panel on or off and further comments entered in the same manner.
To acknowledge multiple alarms,
-
Select the check box for each alarm to be acknowledged in the column at the left.
-
Click the Acknowledge selected alarms button in the widget toolbar.
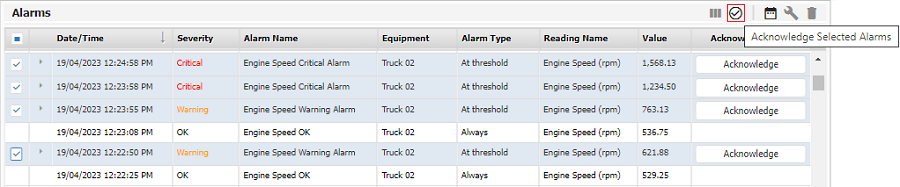
The selected alarms will be acknowledged and comments can be entered using the method outlined above.
Bulb Gauge
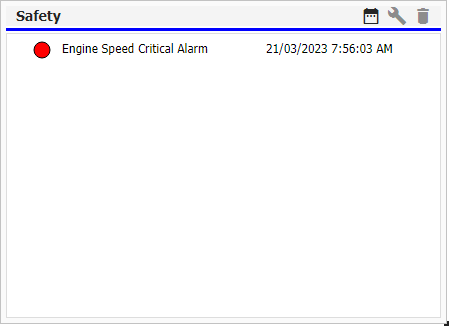
The Bulb Gauge widget displays the current status of one or more selected alarms.
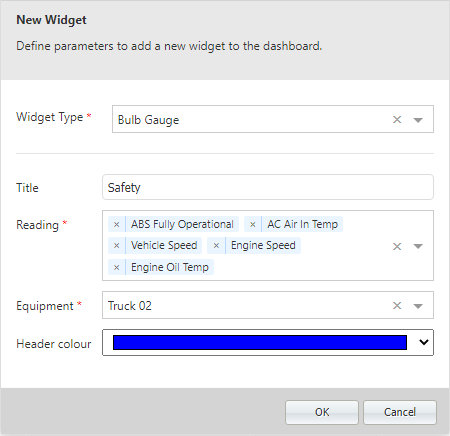
With Bulb Gauge selected from the Widget Type drop down in the New Widget form,
-
Enter a name for the widget in the Title field.
-
Use the Reading drop down to select the Reading Definition to be used for the widget.
Multiple Readings can be selected for the Bulb Gauge.
-
Select the Equipment for the widget from the drop down.
-
Use the Header Colour drop down to select a custom colour for the widget header. This is useful to enable the identification of individual widgets at a glance.
-
Click OK to save the new widget and add it to the selected dashboard.
The widget you created is displayed in the dashboard. You can resize the widget using the control in the bottom right corner. Scroll bars to view all of the available information in the widget will be automatically added to grid style widgets if the size is too small.
Status Map
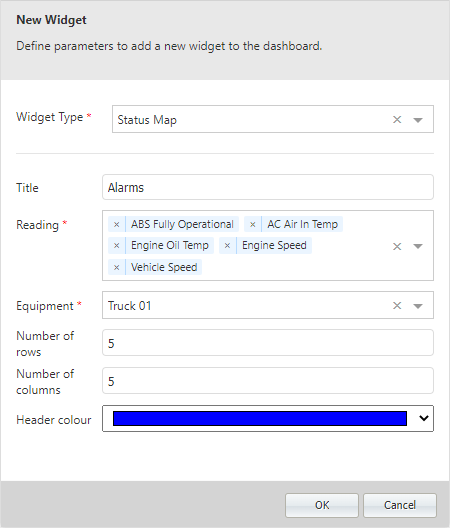
The Status Map widget provides an alternative view to the Bulb Gauge and can be used to display the current status of alarms.
With Status Map selected from the Widget Type drop down in the New Widget form,
-
Enter a name for the widget in the Title field.
-
Use the Reading drop down to select the Reading Definition to be used for the widget.
Multiple Readings can be selected for the Bulb Gauge.
-
Select the Equipment for the widget from the drop down.
-
The Number of Rows and Number of Columns fields are used to configure the layout of the widget. Each event displayed will be shown in a single cell within the rows and columns created.
-
Use the Header Colour drop down to select a custom colour for the widget header. This is useful to enable the identification of individual widgets at a glance.
-
Click OK to save the new widget and add it to the selected dashboard.
The widget you created is displayed in the dashboard. You can resize the widget using the control in the bottom right corner. Scroll bars to view all of the available information in the widget will be automatically added to grid style widgets if the size is too small.