

Display Options
Use the settings provided on the Display Options tab of the Solid Trace form to set the appearance of your solid trace layer.
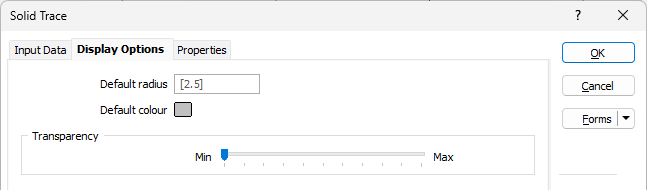
Default radius
Enter a default radius for the cylinders that will be drawn along the trace. The default value will be used when:
-
No Radius field in an Interval file has been specified, or when Radius values do not exist in the Interval file.
-
The Mode is NORMAL and values in the Radius field are negative, blank and/or zero.
-
The Mode is LOG NORMAL and values in the Radius field are less than 1.
Default colour
Double-click (F3) to select the colour that will be used when a Colour field or a Colour set is not defined - or when a value in the Colour field is either not valid or is not mapped in the Colour set.
If you select the Default colour to be NULL (transparent), you can limit the colour-coding of the trace to only those intervals that have assays.
Transparency
Use the Transparency slider to specify the visibility level of the
Intervals
The Intervals options are used to configure the display for intervals in the solid trace input data.
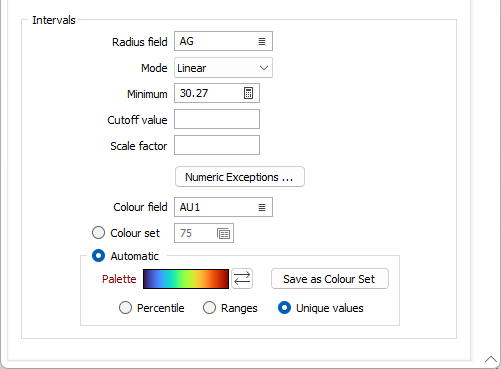
Radius Field
A field in the Interval file can be used to define the radii of the cylinders drawn along the trace. Double-click (or click on the List icon) to select a field on which Mode, Cut-off value, Scale factor and Numeric Exception functions can be performed.
Mode
Note: If the Radius Fieldis not specified, the Mode option is disabled.
Minimum
The Minimum value is used to allow plotting of grades below 1 on a log scale. Grade values below 1 are very important for commodities such as gold.
Use the auto calculate button or enter a minimum grade value in the field.
Cut-off value
Use the cut-off value and/or scale factor (if required) to control the graph limit. They are applied to the data from the nominated field. The cut-off value sets a limit to the extent of the graphs. The scale factor is a multiplier that can be used to reduce (scale factor < 1.0) or increase (scale factor > 1.0) the extent of the graphs.
Scale factor
Enter a scaling factor - typically a value <1.0. The value to which it is applied is multiplied by this factor before being displayed. Use this option to prevent graphs from overwriting other holes.
Numeric Exceptions
Downhole readings are taken at regular (often centimetre) intervals. Often there are no valid readings near the top of the hole and these need to be ignored when drawing the graph.
(Optionally) Use the Numeric Exceptions group to control the way that non-numeric values are handled. Non-numeric values include characters, blanks, and values preceded by a less than sign (<).
Colour field
Specify the name of a field which contains the values that will be used to colour-code the display.
You can choose to select colour values directly from the Colour field without selecting a Colour set. In this case, the values in the Colour field must be valid RGB, Hex, or Integer colour definitions.
| Format | Example |
|---|---|
| R,G,B | 89,169,215 |
| HTML Hex | #59A9D7 |
| Hex | 0x59a9d7 |
| int | 5876183 |
Colour set
To map values in the Colour field to the colour values in a Colour set, double click (F3) to select the set that will be used to control the display colour. Right-click (F4) to create or edit a Colour set.
Automatic
Select Automatic to select a palette and automatically apply colour ranges to the data. The Save As Colour Set button provides the option to save the result as a colour set.
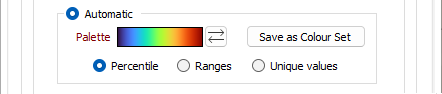
Choose a mode of calculation:
| Mode | Description |
|---|---|
| Percentile | The application will divide the data into ranges each containing the same number of values; the highest and lowest value in each bin will define the upper and lower values for each range. |
| Ranges | The data will be divided into equal ranges. |
| Unique values | A colour will be assigned to each unique value. |