Options
In the Options tab of the Aggregate Block Model form, you can specify the per-block output file summary statistics to be generated and the realisation fields to be included. Additionally, you can configure probability cut-off and entropy settings.
Per-block output file summary statistics
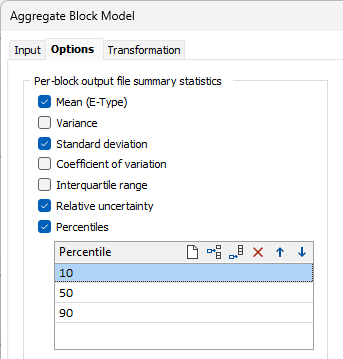
Select the required summary statistics to be computed per block in the output file from the options provided. For each of the following options selected, a column will be written to the file:
-
Mean (E-Type) - The column reports the value in the middle of the range of data in the row.
-
Variance - The column reports on the variation between values in the data, measuring the difference between the values and their average.
-
Standard deviation - This value is the square root of the variance. A low value indicates the data is collected close to the average value, while a high value suggests a larger spread.
-
Coefficient of variation- Reports on the spread of probability values; representing the ratio of standard deviation to mean.
-
Interquartile range - Reports the middle 50% value for the row, which is the difference between the 75th and 25th percentiles of the data.
-
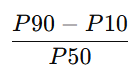
Relative uncertainty - The Relative Uncertainty column reports a value of uncertainty about the information derived from the 90th (P90), 10th (P10) and 50th (P50) data percentiles using a formula as follows:
-
Percentiles - Enter the percentiles to be considered in the summary.
Use the buttons on the local toolbar to Manage the rows in the list.
For example, you might commonly want 10 (P10), 50 and 90 (P90); with 10 representing the 10th percentile (i.e. the 10th lowest grade) and 90 representing the 90thpercentile (i.e. the 10th highest grade). The 50th percentile is closest to the mean.
Probability greater than cut-off
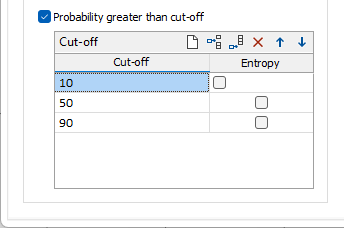
Select the Probability greater than cut-off option to use specified cut-offs to determine the probability that a statistical row has a grade above that cut-off.
Enter a Cut-off in the field provided.
Use the buttons on the local toolbar to Manage the rows in the list.
For example, for gold grade summary statistics, if you enter 1 as a cut-off, the application will calculate the probability that a sample will contain more than 1 gram per tonne of gold by the number of rows that are above the cut-off.
Use the buttons on the local toolbar to Manage the rows in the list.
Entropy
If you select the Entropy option, the Entropy column will be added to the Percentiles summary to display the calculated entropy for the percentile.
The Entropy column reports the Shannon entropy associated with the probability that a block exceeds the specified cut-off:

Entropy is the quantified measure of uncertainty that a block is above the specified cut-off value. Entropy values closest to 0 indicate a low uncertainty (probability close to 0 or 1), while higher values (peaking at a probability of 0.5) indicate maximum uncertainty about whether the block is above or below the cut-off.
Realisation fields included in output file
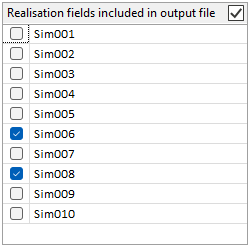
The Realisation fields... grid displays the realisation/simulated columns to be output to the destination file. Enable the grid with the option and include or exclude a field in the list using the corresponding check box.