

Workflow
The Variograms workflow relies on the Semi Variogram Map to define the plane containing Axes 1 and 2 along with the pitch of Axis 1 in that plane. All of the other orientations (strike, dip, axis azimuths and plunges) are calculated from those angles. You then set up a Semi Variogram model containing just those three axes.
To create the variogram display:
- Follow the steps in the Variogram Map Modelling Process to create a series of variogram maps defining the strike and dip of the orebody along with the pitch of Axis 1. Save the result as a variogram control file.
- Click Variograms on the Geostatistics tab, in the Variography group.
- Set the Input to Calculate, the Direction to Directional and the Type to Variogram.
- Set up the relevant Raw Data, Data Values and Transform options.
- On the Display tab of the form, enable Show Variance and then click the Semi Variogram Directions button on the Setup tab.
- Set the Variogram Control File to the file you created earlier.

The variogram control file will set the orientations to the ones you defined on the variogram map, automatically ensuring they are at right-angles to each other.
- For numbers that will remain constant (such as tolerances), enter the value in any cell in that column and then right-click it and choose Replicate from the pop-up menu.
- Set the relevant Display modes. To apply the same mode to all variograms, right-click that cell and choose Replicate from the pop-up menu.
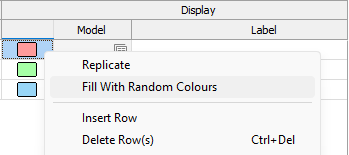
- Right-click any cell in the Colour column and choose Fill With Random Colours.
Note: When generating random colours, the application will use the Vizex background colour as both a colour to avoid and as the contrast / background reference for visual clarity. This means dark backgrounds generate lighter, slightly softer/pastel colours, and light backgrounds generate darker, more saturated colours. Mid-tone backgrounds rely mostly on contrasting colours.
 Fit a Single Theoretical Variogram Model
To fit a theoretical model to a single experimental variogram:
- With the graph displayed, disable Show Together (on the Geostatistics tab, in the Variography group).
- Click Chart Controls Pane (in the Panes group) to display the Chart Controls.

The application will automatically fit a linear variogram with estimated values.
- Use the Chart Controls pane to change Component 1’s Type to something more appropriate.
- Try to fit the experimental data using just one component. Adjust it by dragging the handles attached to the Nugget and Component 1.
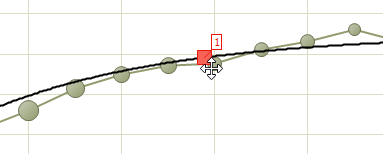
- If you cannot get a good fit, move the model down to the first sill, ignoring the rest of the graph.
- Add a component by right-clicking the model near the new component’s range and choosing Add Component here:
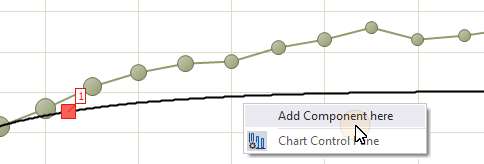
- Set the new component Type and adjust it to the total sill.
- Compensate the previous component.
- If you still cannot get a good fit, return to Step 5.
- Refine if necessary.
Done!
Refine a Variogram Model
Two enhancements simplify the task of refining a variogram model:
- The Goodness of Fit (Noel Cressie Statistic) is always visible and constantly updated, and
- Model parameters with spin controls now respond to the mouse wheel.
To make fine adjustments to a variogram model:
- Ensure the Goodness of Fit for the current variogram is visible in the Properties window.
- Tab or click into the parameter to be adjusted (nugget, range, partial sill etc.).
- Roll the mouse wheel away to increase that value and towards you to decrease it, observing the Goodness of Fit as you do:
If it goes up, roll the mouse wheel the other way.
If it goes down, keep rolling in the same direction.
- Tab or click onto the next parameter and repeat.
Change the sensitivity of the mouse wheel by adding or removing a decimal value from the parameter being adjusted.
- Stop adjusting when the Goodness of Fit reaches its lowest value.
Don’t become a slave to the Goodness of Fit. It is just a way of suggesting the direction in which you should adjust a parameter and its absolute value is meaningless. Simply choose adjustments that reduce it.
Fit Three-axis Theoretical Variogram Models
The creation of three-axis theoretical models is simplified by the ability to lock component parameters across multiple axes. This useful feature:
- Assigns the component type and partial sill of the selected axis to all remaining axes, and
- Prevents the partial sill from being adjusted whilst still allowing changes to the range.
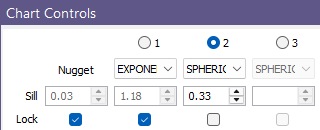
This virtually eliminates the risk of accidentally changing a parameter and violating the geometry of the model.
To fit theoretical models to a three-axis set of experimental variograms:
- Configure and display the three experimental variogram axes with Show Together enabled.
- Click the Chart Control Pane button to show the Chart Controls.
- Create an initial model that roughly fits the partial sills of the three axes.
The unadjusted linear variogram belongs to the other two axes. Ignore it for now.

- Once you have created the approximate model, enable Lock Axes for the newly-added components.
The component types and partial sills of the other axes will sync to the one you are editing.
- Disable Show Together and then use the Next and Previous buttons to assess the individual axes.
- Adjust the range of each axis/component combination as needed.
- Adjust the partial sill of a problem component by disabling Lock Axes for that component.
- Re-enable Lock Axes once you are satisfied.
Re-enabling Lock Axes will sync the other two axes to that one.
- Re-enable Show Together and review the overall model.
- If the overall model is poor, return to Step 5 and repeat.
- Optionally choose a different Colour for each axis.


Embed Variogram Models in the Main Form
Saving the variogram models will automatically embed them in the main form, making it easy to redisplay existing models or include an image of the models in a resource report.
To save the individual variogram models
- Disable Show Together:
- Click the Forms button in the Chart Controls and enter a title.
- Use Next or Previous to step to the next axis.
- Repeat Steps 2 and 3 for the remaining axes.
To save the main form for later reuse
- Click the Form button at left of the Chart toolbar, or double-click Semi Variograms in the Vizex Layer Display pane to redisplay the main form.
- Set the Input to Display Existing.
- Click the Semi Variogram Directions button and then note the contents of the Model column:
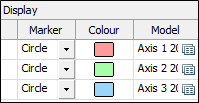
- Save the main form by clicking Forms followed by Save As.

The models are saved as part of the main form. You can optionally display them without the experimental data by setting the Marker to None and disabling all of the other display options.