3D Viewer
The Nexus Viewer allows for the visualisation of your project data in 3D. Tools in the Viewer allow you to manipulate (Move, Rotate, Zoom) your display objects in 3D space. An option to display those objects in Section View is also provided.
The following tools are provided:
|
|
The Select tool is used to select sections of the object in the Viewer. |
|
|
The Move tool is used to grab and drag the view of the object up, down, left and right inside the Viewer window. This will move the view of the object without changing the coordinates. |
|
|
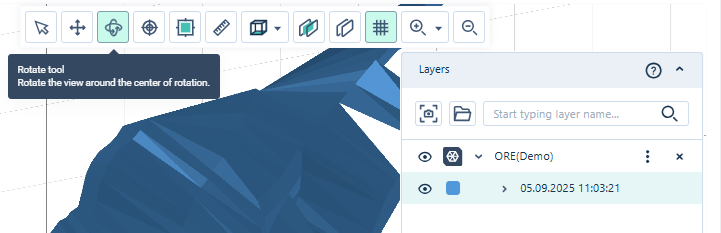
The Rotate tool will rotate the Viewer grid in 3D space when the mouse button is held down.
|
|
|
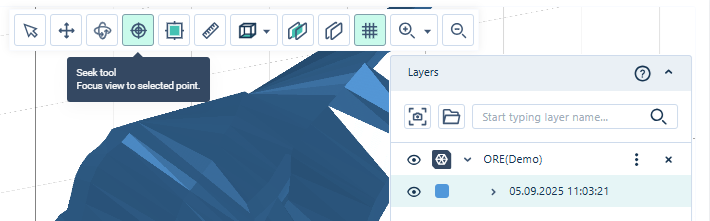
The Seek tool is used to select the centralised rotation point for the Rotate tool. If you select the tool and then click a coordinate point, rotation for the object will occur at that fixed point.
|
|
|
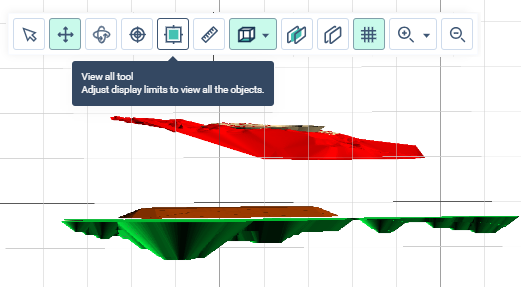
The View All button will adjust the zoom and perspective of the Viewer so that all displayed objects can be seen completely - regardless of their position in the grid.
|
|
|
The Measure tool, when active, allows you to draw a line or multiple lines on the Viewer grid to measure the distance between points. This process is outlined in Measure Distance. |
|
|
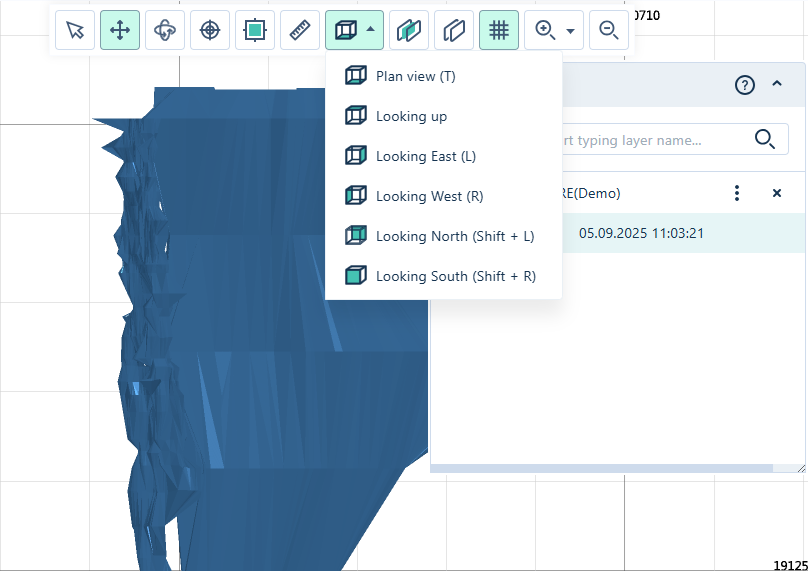
The Plan View tool provides a menu of various perspectives which can be applied to the Viewer grid.
The available perspectives are Looking Up, Looking East, Looking West, Looking North and Looking South. |
|
|
The Section tool is used to define a section view of an object in the Viewer. See: Define a Section |
|
|
When a section is defined, the Section View toggle is used to enable or disable Section view. |
|
|
Use the Coordinate Grid button to toggle on or off the display of lines for the coordinate grid in the Viewer. |
|
|
The Zoom In tool and Zoom selection tools are used to zoom in on the object visualisation. The Zoom In tool will zoom one level in on the Viewer with each click of the tool in the grid. With the Zoom selection tool enabled, you can left click (do not hold click) to start drawing a rectangle to highlight the area you want to zoom in to:
While selecting an area, panning and rotating the camera/scene will be disabled. The rectangle representing the area you are selecting, has the same width/height ratio as your Nexus window. This means that the area within the rectangle (approximately) corresponds to what you will see after you finish the selection. Left click again to complete the selection and the selected are will zoom in:
While selecting an area, panning and rotating the camera/scene will be disabled and you can press Esc to cancel the selection. |

|
The Zoom Out tool is used to zoom out on the object visualisation. A single click of the tool in the grid will zoom one level out on the Viewer. |


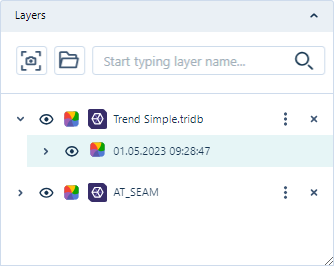
Layers Panel
The Layers panel lists the layers in the Viewer window for each object you have displayed. From the panel, you can toggle the display of layers on and off, set a custom colour for each layer, select a version of the object file to display and more.
You can collapse the Layers panel to increase your view of the Viewer, using the arrow at the top right-hand corner of the panel.
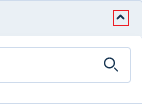
This will collapse the panel to leave only the header. You can display the full Layers panel again by clicking the arrow a second time.

The tools provided in the Layers panel are as follows:
|
|
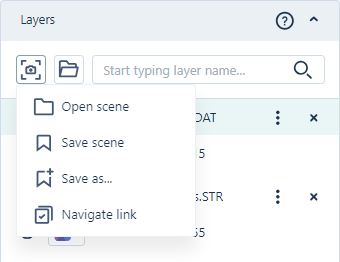
The Scene button is used to save a scene in the Visualiser as an object that can be opened and viewed later, as well as shared. If you click the Scene button, a menu opens containing options to Open a scene, Save or Save As the current scene, Download a link to the scene that can be shared and save a link to the Library or Project that will Navigate to the scene.
|
|
|
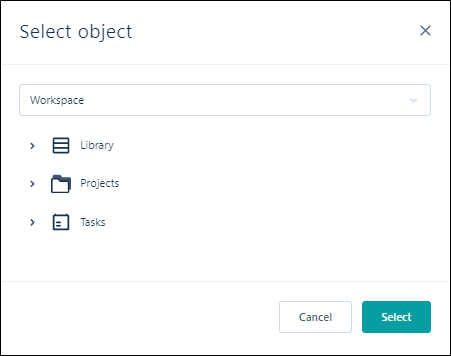
The Open button enables you to navigate to an object in a selected Workspace to open in the Visualiser. The Select Object dialog is displayed when you click the Open button:
Select the Workspace where the object is located, and navigate to the relevant Library, Project or Task to open the object. |
|
|
The Search button and the corresponding field are used to search for the name of a layer in the panel. |
|
|
The Show / Hide Layer buttons toggle the display of the layer in the panel list. |
|
|
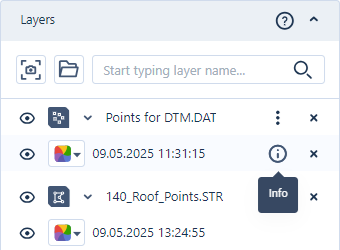
The Info button is displayed on hover for the colour layer:
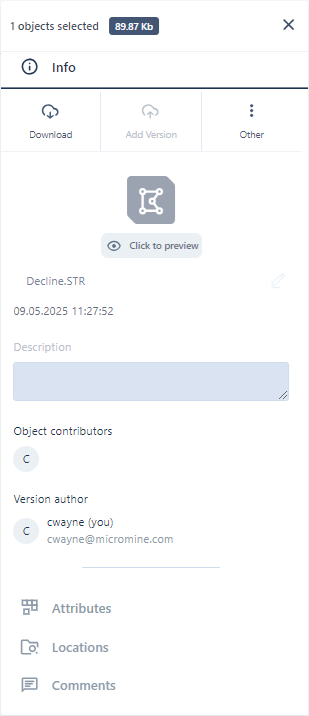
Clicking the Info icon opens the File Info panel for the file in the Layers panel.
Attributes and Comments can be added to the selected file in the same way as for the File Info panel in your Library and Projects. The Info panel can also be opened using the Open info panel option from the More menu for the main layer. |
|
|
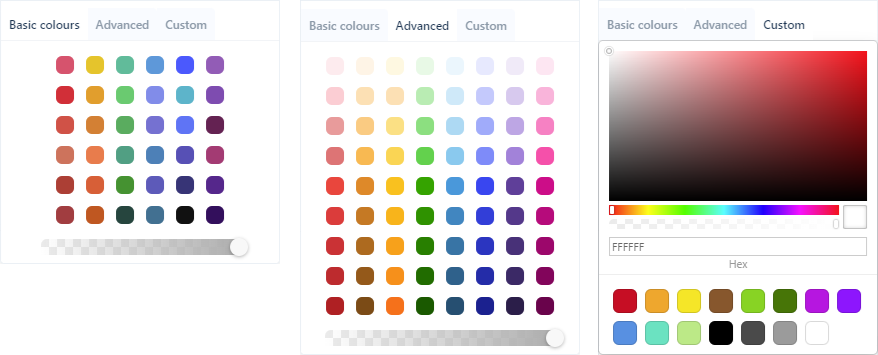
The Layer Colour button is used to select a colour coding or default colour for the display of the layer in the Viewer. If you select Default Colour, a selection form will open and you can select the required default colour from a selection panel.
The Basic colours, Advanced and Custom tabs of the selection panel provide increasingly expansive colour palettes to use for selecting your default colour.
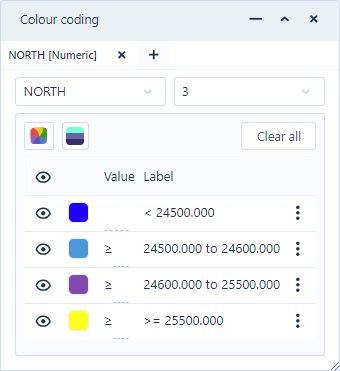
If you select the Colour coding option, the Colour coding panel will open and you can select the Colour field and configure the colours for display.
The Transparency slider at the bottom of each colour palette controls the Alpha channel. The Alpha channel in the RGBA colour space sets the Transparency for the selected object - determining how 'see-through' it is.
|
|
|
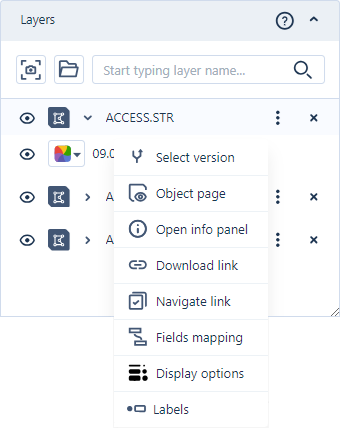
The More menu button opens the More menu from which you can access a number of tools. See More Menu. |
|
|
The Close button will remove the layer in the list from the Viewer. |


If required, you can use the Vertical Exaggeration control at the bottom right of the Viewer to change the Z scale for the visualisation.
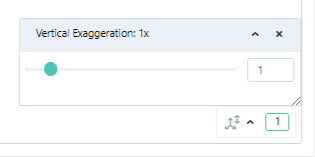
Adjusting the vertical exaggeration is useful when visualising large areas with short traces and a very small Z range such as alluvial ore bodies and stratiform deposits such as coal. Without an adjustment to the Z dimension, it is sometimes difficult to recognise that there are two polygons very close together.
Note: Vertical exaggeration is applied to the display and not to the coordinate data.
More Menu
|
|
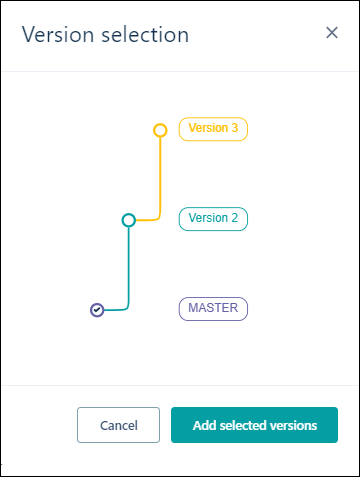
The Select Version option is available from the More menu for the main layer.
The Select Version option is used to select a different version for the file displayed in the Viewer. If you select the option, the Version selection form will open and you can select the alternate version of the file to be displayed.
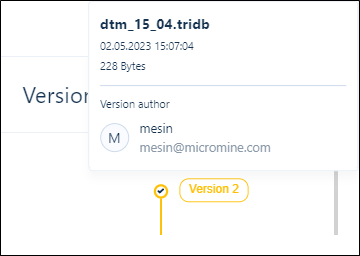
If you hover on the option for a version, information on the version will be displayed in a pop up.
For more information on versions, see: Branching. |
|
|
The Object Page option is available from the More menu for the main layer.
The Object Page option opens a page which display various details for files and display objects. For details of the information contained on the page, see Object Page. |
|
|
The Open Info Panel option opens the File Info panel for the file in the Layers panel.
Attributes and Comments can be added to the selected file in the same way as for the File Info panel in your Library and Projects. The Info panel can also be opened for files by hovering on the colour layer and clicking the Info icon which appears:
|
|
|
The Download link option will create a link that can be shared with external users to download the file/object, where available. A URL is created which can be provided to external people without access to Micromine Nexus, in order to share data and allow the download of the object. |
|
|
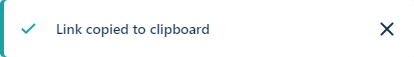
The Navigate link option will copy a link to the selected file to the clipboard, as notified:
This link will navigate to the file in the tenant and display the details in the Info panel. If the Navigate Link was created from the Viewer tools, the file will be opened in the Viewer. |
|
|
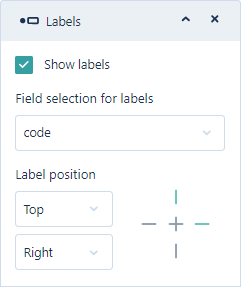
To show labels for display objects such as points and strings:
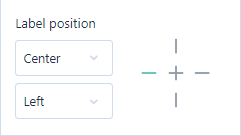
Using the Label position options you can select the placement of the labels in the display.
The Cross at the right of the Label position options provides a preview of the location for the label that you have set. For example, in the above dialog Top and Right are selected and so the top and right part of the cross are coloured green. If Centre and Left were selected, the preview would appear as follows:
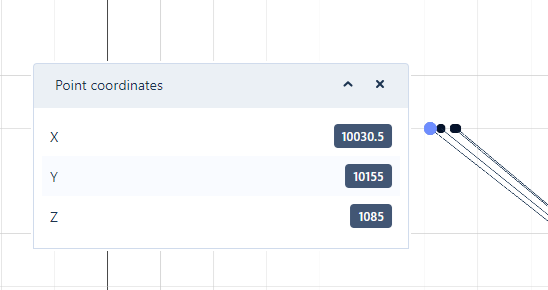
If you select a point on a string with the Select tool, the coordinates of that point will be displayed in a pop-up dialog:
The Labels option in the More menu opens the Labels dialog which allows you to set the field to generate displayed labels, as well as the position of display:
|

Field Mapping, Display Options and other options on the More menu will depend on the type of object that is being displayed in the Viewer.
For specifics on how to establish a connection to Nexus from your Micromine application and upload and view your project data, refer to the online help for that application and search "Nexus Integration".