

Cut-off
Use the Cut-off tab to specify cut-off points for the following charts:
-
Grade Tonnage Curve
-
Change of Support
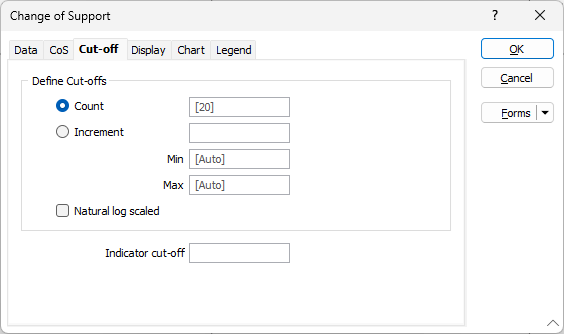
Define Cut-offs
Count
Cut-off points are calculated using the min/max of the data and the Cut-off count value you specify here (10 is the default for the Grade Tonnage chart; 20 is the default for the Change of Support chart).
Each point on the graph represents the data at each of these cut-offs, plus the average grade and tonnage of the data at that applied cut-off.
Increment
Alternatively, specify an increment value and optional minimum and maximum cut-off values. The process will auto-fit between the minimum and the maximum of the grade data if unspecified.
Natural log scaled
Select this option to calculate the values along the X axis and Y axis in a natural logarithmic range.
Indicator cut-off
For the Change of Support chart, enter an indicator cut-off value to show a dashed line on the chart to indicate the grade and the tonnage at that cut-off.