

Graticule Frame
A Graticule can be added to a plot to show lines of latitude and longitude.
Note: For graticule frames created prior to Micromine Origin & Beyond version 26.5, see Graticule Frame (Legacy).
To add a Graticule to a plot:
- Right-click on the plot frame (in the layout window or the Frames pane) and select Add Graticule. Alternatively, double-click on the Graticule form set type in the Plot Forms pane.
- Set the following parameters on the Lines tab of the Graticule form:
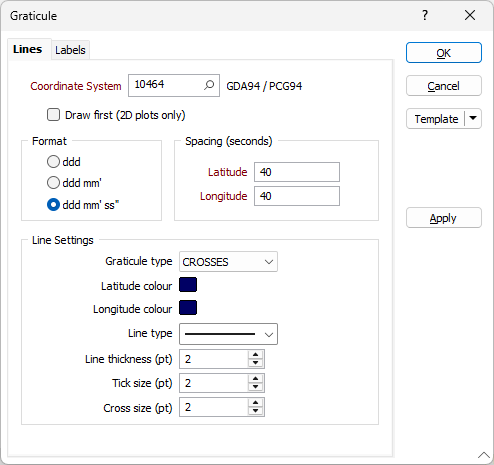
Coordinate System
Search for the coordinate system by name or enter the EPSG (European Petroleum Survey Group) code if you already know it. For example, the geographic WGS 84 coordinate system has the EPSG code 4326. This method is ideal for converting between recognised coordinate systems.
 Click the Search icon to browse the EPSG coordinate reference system dialog. The currently used EPSG coordinate reference system (if any) is selected by default:
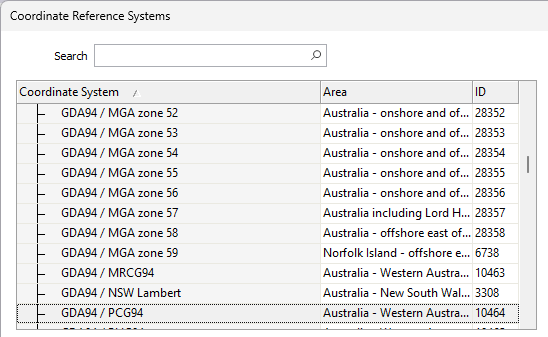
Double-click in the Coordinate System box to select the required Coordinate System.
Draw first (2D Plots only)
In some cases grid lines may obscure the data. Select the Draw first option to ensure that the plot data is always drawn on top.
This option only applies to a 2D plot and does not apply to a Vizex plot. Since a background is part of the Vizex plot data, if a grid is drawn first it will be completely obscured by the background.
Format
There are three formats for graticule labels:
- ddd°
- ddd° mm’
- ddd° mm’ ss”
Select one of these options. The units in which you must specify the graticule spacing changes according to which of these options you select.
Spacing
Set the Latitude and Longitude spacing for the format you have selected (degrees, minutes, seconds).
Line Settings
Graticule Type
Select the type of graticule to display:
- CROSSES draws tic marks around the plot border and crosses wherever grid lines intersect.
- FULL draws lines from one side of the paper to the other.
- TICKS draws tic marks around the plot border.
Latitude and Longitude Colour
Double click in the response boxes to specify the Colour of the lines of longitude and latitude.
Line Type
Select a Line Type from the drop down. A preview of each line type is shown in the drop-down list. A variety of solid, dotted, and dashed line styles are available for selection.
Line Thickness
Enter a Line thickness in points.
Tick Size
Enter a Tick Size in points. This is the length of the tick lines.
Cross Size
Enter a Cross Size in points. This is the length of the cross lines.
When a spin control has focus, you can use the mouse wheel to increase or decrease the displayed value.
Labels
Click on the Labels tab to specify how the graticule lines will be labelled.
In the case of a grid or a graticule there are no common (fill, border, and margin) frame properties to specify, since the grid or graticule is added as a child frame of the parent plot frame and automatically fills the extents of the parent plot frame.
You can only select a grid or a graticule in the Plot Frames pane.